
We recently completed several major upgrades to the Coastal Flooding Dashboard developed for our ShorelySafe towns and counties.
The updated platform includes an interactive dashboard tour, current and historical flooding comparisons, annual forecasts, 50 years of coastal flood data and sea-level projections extending toward the 22nd century. Users can also customize each chart to focus on the information most relevant to them.
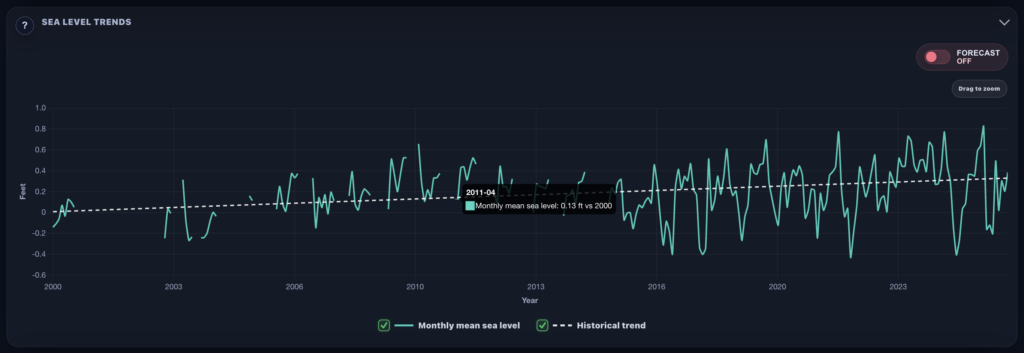
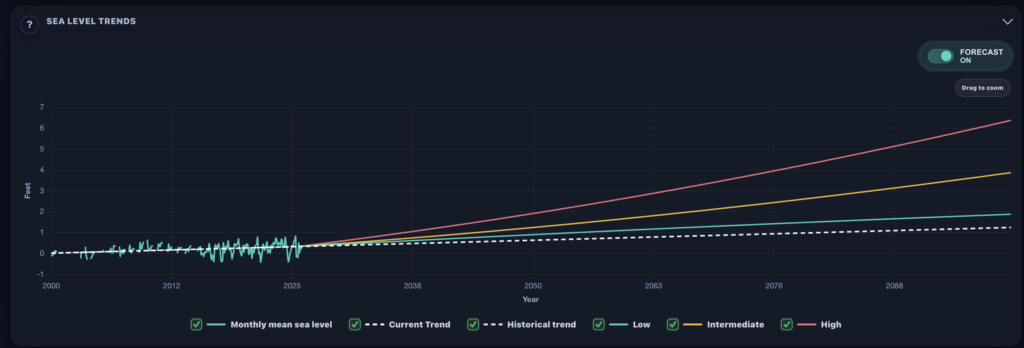
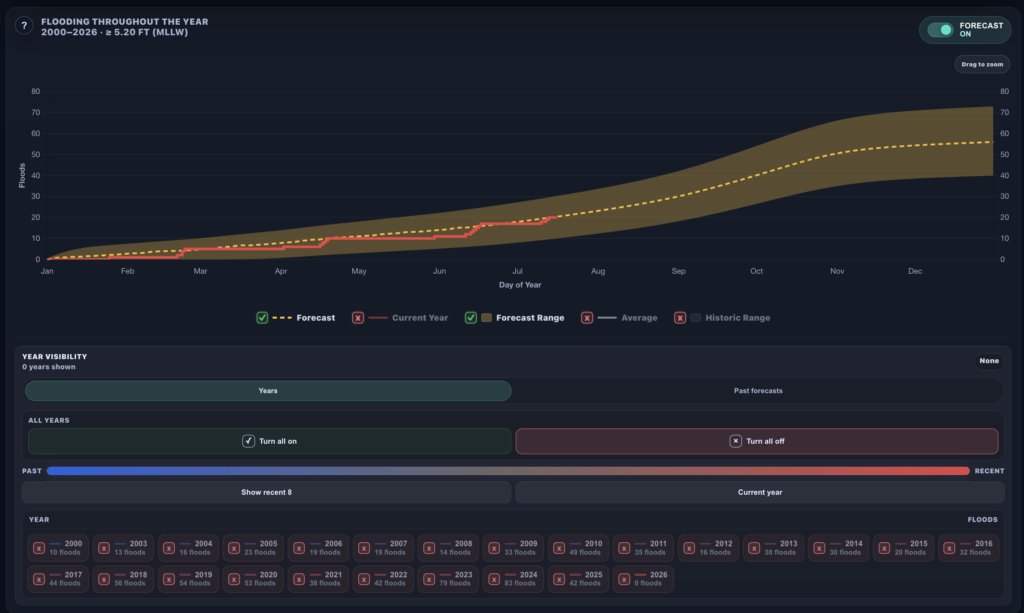
These improvements make complex coastal data easier for residents, municipal leaders and emergency managers to understand and use.
That includes you reading this today! Our in-house Flood Mapper and Flood Dashboard are available to the public in that community.
As flooding becomes more frequent, tools like this can strengthen public awareness, planning and coastal resilience.
View the attached images and visit the dashboard to explore the new features. Ask your town or county to sign up for ShorelySafe!


