Tag: meteorology

  • The Awe-Inspiring Fathers of Meteorology (Plus Joe’s 2 Weather Dads)

    The Awe-Inspiring Fathers of Meteorology (Plus Joe’s 2 Weather Dads)

    This story originally appeared in Shore Local Newsmagazine on June 12, 2025.

    Meteorology, the study of weather, is a pretty new science, even though the word comes from Ancient Greek, meaning “the study of things high in the air.” In 340 B.C., the Greek philosopher Aristotle wrote a paper called “Meteorologica,” but after that, not much happened in weather science for 2,000 years.

    Things began to change in the 1700s when tools like the thermometer (to measure temperature) and the barometer (to measure air pressure) were invented. These tools let people start observing and recording weather data. But progress was slow until the 1830s when Samuel Morse invented the telegraph. This allowed weather information to be shared quickly across long distances, and that’s when modern record-keeping really began. Even so, weather forecasts back then were basic and often wrong.

    It wasn’t until the 1950s and 1960s, when computers were developed, that meteorology really took off and became the advanced science we know today. Since most of the big discoveries in meteorology happened fairly recently, we have good records of the people who helped shape the field. I chose four important meteorologists to highlight, plus two more who are special to me personally.

    Aristotle

    Aristotle is the only person on this list that lived before the Modern Period, which is commonly defined as 1585 or later, according to The American Heritage Dictionary of the English Language.

    In 340 B.C., the Greek philosopher wrote a paper called “Meteorologica,” which became the basis for all modern-day texts on weather for more than 1,300 years. Broken down into four books, the first three, dealt with what we’d now call meteorology, according to H. Howard Frisinger in his 1972 paper in the Bulletin of the American Meteorological Society.

    Aristotle was the first major figure to illustrate major weather-related concepts such as:

    1) The Earth is a sphere (it’s really slightly oval but this is close enough).

    2) Astronomy had to do with what we now know as outer space, and meteorology had to do with what we now know as the atmosphere.

    3) Weather varies by region and seasons based on latitude and proximity to water.

    4) Wind is air in motion.

    5) How the water cycle works. He noted that water evaporates from the Earth’s surface due to the sun’s heat, cools in the atmosphere and falls back to earth as precipitation.

    He didn’t get everything right. For example, he believed that earthquakes were caused by underground winds. It’s also important to note that not all of these ideas were his own. Frisinger notes that some came from the Egyptians and the Babylonians. Still, he was the first to curate all of this into a text that would be cited frequently until the 1700s and even later. You can’t have a list of greatest meteorologists without including him.

    Cleveland Abbe

    The current conditions at your local airport, the surface weather map you see and America’s largest source of employment for weather forecasters are all traced back to Cleveland Abbe

    The National Weather Service calls him “America’s First Weather Forecaster.” Born in 1836 in New York City, he attended Harvard University and then moved to Cincinnati, Ohio, in 1868, becoming the director of the Cincinnati Observatory.

    He progressed tremendously in the science of meteorology from then on, persuading telegraph operators to report daily weather conditions by using guidelines that he established. That included wind direction, wind speed, type of clouds, sky color, rain amounts, temperatures and barometer readings.

    On Sept. 2, 1869, The Cincinnati Commercial newspaper reported weather conditions for four cities. By the end of the month it was nine, and in 1870 it grew to 69. It was the first time the public and scientists alike could know what was happening in other parts of the country in less than a day – tremendous for the time.

    The success was so great that Congress passed a resolution on Feb. 9, 1870 to create a national Bureau of Storm Signals. Under the United States Army, it created stations across the country, taking weather readings three times a year. On Nov. 1, the first observations were reported back to Washington, D.C.

    The first United States weather observations that were done across the country at the same time. This is Nov. 1, 1870.

    Abbe was then asked by the federal government to begin what we now know as the National Weather Service. He did so in 1870, laying the foundation for meteorology in the United States, and creating standardized methods of data observation and primitive forecasting. He would go on to create the Monthly Weather Review, which still exists within the American Meteorological Society.

    The War Department of the United States was responsible for issuing surface weather maps in 1872. Using the small, but national network of observations, early meteorologists plotted air pressure systems and wind direction. (via National Weather Service)

    Dr. Vilhelm Bjerknes

    To put it simply, modern weather forecasting as we know it does not happen without Vilhelm Bjerknes. The Norwegian (1862-1951) founded the Bergen School of Meteorology in 1917, developing the thought process that essentially created modern meteorology.

    Bjerknes, and the Bergen School built on Abbe’s weather mapping, established modern meteorology. They introduced:

    1) Cold and warm fronts – narrow zones of weather such as rain or snow separating air masses.

    2) The lifecycle of mid-latitude cyclones and low-pressure systems like nor’easters impacting areas from Florida to Alaska.

    3) Numerical weather forecasting, using equations to predict future weather from current conditions.

    Forecast computer models are more accurate than ever before. This data is from the European model and does not factor in Meterologists, which add skill to these computer model forecasts, too. (Via Hannah Ritchie on Wikipedia)

    Bjerknes’ equations were visionary, but incomputable until 1950. The first six-hour forecast was done by hand and took six weeks. Today’s equations are far more precise, powered by computers that are far more powerful than the 1950s versions, delivering fairly accurate forecasts for human meteorologists to refine. Numerical prediction dominates, but artificial intelligence is gaining ground in 2025.

    Dr. William Gray

    Considered the father of hurricane forecasting, in 1984 William Gray took on what the weather community still couldn’t touch by forecasting the tropical cyclones months out, and made it his own.

    A United States Air Force veteran, he earned his PhD in 1964 at the University of Chicago. He then went to Colorado State University, a landlocked state, to research hurricane forecasting.

    Gray looked at big patterns like ocean temperatures, El Niño, and rainfall in Africa’s Sahel region, to make seasonal hurricane forecasts, with accuracy. His work helped communities prepare months in advance, saving lives and property.

    Gray’s methods mixed real-world data with science, making forecasts more accurate. He also discovered that the number of hurricanes in the Atlantic Hurricane Basin go up and down in roughly 30-year cycles. We are currently in a high-activity period. However, it began in 1995, therefore, we should see less activity through the 2030s and 2040s.

    The cycles of the Atlantic Multi-Decadal Oscillation. (Via National Oceanic and Atmospheric Administration)

    His legacy lives on through his student Phil Klotzbach, who continues the forecasts, and other scientists worldwide who use similar ideas. Gray wrote more than 80 research papers and mentored many meteorologists.

    Dr. Dave Robinson

    Dave Robinson, the New Jersey State Climatologist and I during our March Monthly Weather Roundup Show you can watch for free. Dave is my birthday buddy (May 13) and weather dad.

    Dave Robinson is one of my two “weather dads,” former research advisor and my birthday buddy. Robinson is the New Jersey state climatologist and America’s longest serving state climatologist of all time, a job he took on in 1991. I was born the same year, so he really is my weather dad in a way. He is also a distinguished professor at Rutgers University.

    As the state climatologist, he runs the New Jersey Weather Network. Over 60 stations give super specific, up-to-date weather info for local areas. His network is great at catching things like cool sea breezes or strong wind gusts from a single thunderstorm, as well as doing it more frequently than the bigger national weather networks.

    He also runs the state’s Community Collaborative Rain, Hail and Snow Network (CoCoRaHS), the nation’s largest citizen scientist program. Some of you are CoCoRaHS members because of his work and outreach. Anytime you see me, another meteorologist, or journalist talk about specific weather or climate conditions in the state, he has his hands on it. Furthermore, he’s been my co-host of the “Monthly Weather Roundup” show online since 2018.

    Globally, he’s known for his snow cover resources. He’s the operator of the Rutgers Global Snow Lab. Researchers across the globe use this for their research. Not many people like snow more than he does, and even in New Jersey, he’ll get a good snowshoe in after fresh powder comes down.

    Jim Eberwine

    Jim Eberwine and I are all smiles in the Joe DiMaggio room at The Irish Pub in Atlantic City!

    Jim’s my second weather dad. A United States Marine Corps veteran, he spent decades at the National Weather Service, first at Atlantic City International Airport, and then at Mount Holly, Burlington County, until he retired in 2010.

    Jim Eberwine isn’t really retired, though. He helps keep Absecon safe as the emergency management coordinator, teaches a class at Atlantic-Cape Community College and works with the Federal Emergency Management Agency to train others.

    Back in the late 1980s and early 1990s, Jim and Dean Iovino, retired lead meteorologist for the NWS, worked together on something cool. They figured out which streets near the coast would flood during nuisance events. They called their project “Operation Crabcake” because they ate crabcakes together while working on it. Their work helped people know when their streets might get flooded just by checking tide forecasts.

    Jim walked 127 miles, from Sandy Hook to Cape May, and even other places like Delaware Bay and the Delaware River, recording videos of spots that flood easily. His hard work helped emergency teams and weather experts work better together. People were amazed at how well Jim knew every road’s flooding potential.

    If you follow me online, you’ll see me call both Dave and Jim my weather dad. They’re mentors, friends and people that helped me with my professional weather career. I talk to Jim on the phone about once a week, and we text even more.

    Jim is South Jersey Shore weather, and, in many ways, his legacy is stronger than ever before.

  • 6 awesome hurricane updates you’ll see in 2025

    6 awesome hurricane updates you’ll see in 2025

    By Meteorologist Joe Martucci

    This article initially appeared in Shore Local magazine on May 29.

    Hurricane season begins on June 1. Really, in New Jersey, we like to say that there’s a 12-month hurricane season. After all, it’s the water, not the wind, that causes the most devastation, and nor’easters bring plenty of water.

    Sadly, the 30-year average for flood deaths is 113 a year, compared to 78 for winds in the United States, according to the National Weather Service. Safety, preparation and information are at the top of every meteorologist’s mind, including the fine folks at the National Hurricane Center in Miami, Fla. Every year they come out with new products, updates and changes to keep you as safe as possible from hurricane season, which will end officially on Nov. 30.

    This year, there are six. They range from rip currents to wind forecasts, to the change in the size of the forecast cone that you see. Here are the updates below, including how you’ll be able to see them.

    Inland watches and warnings on the forecast cone map

    The forecast cone is the essential part of understanding what is going on with a tropical system. The cone shows the forecasted path, along with data on location, movement, wind speed as well as watches and warnings.

    Before 2024, only the coast was outlined in the applicable watches and warnings (Tropical Storm Watch, Hurricane Warning, etc.) on the map. However, these alerts often went well inland and there was no way to see that on the map.

    Current conditions and forecast cone for Hurricane Irene in 2011. New Jersey was 48 hours away from landfall, which came ashore as a weaker. tropical storm. Note that red hurricane warnings only outline the coast (National Hurricane Center).

    Last year, the NHC added all areas that were in watches and warnings to the map, whether they were a coastal county or not on an experimental basis. This year, they continue to keep it, but “will now contain the symbology for areas where a hurricane watch and tropical storm warning are simultaneously in effect (diagonal pink and blue lines).

    Current conditions and forecast cone for Hurricane Helene in 2024. Note that red hurricane warnings extend inland to Florida and Georgia. also, there is a shaded pink and blue area in the Tampa, west coast, region of Florida (National Hurricane Center).

    So, if the Jersey Shore counties were in a hurricane warning, and the inland New Jersey counties were in a tropical storm warning, all of the counties would be colored in on the map. If Atlantic County were in a hurricane watch and tropical storm warning, it would have a diagonal pink and blue line over the county. This came in handy during Hurricane Helene last September. Tropical storm watches were in effect as far inland as western North Carolina.

    Before 2024, you would only know that if you lived in those counties, saw a news segment on it, or dug deep into the National Hurricane Center website. However, last year, you could see it right on the map. Of course, Helene brought catastrophic flooding to western North Carolina — $79 billion in damages were estimated to have occurred, according to the National Hurricane Center.

    Rip current risks shown

    When a tropical storm or hurricane is active in the Atlantic Hurricane Basin, the National Hurricane Center will provide rip current risk information on a national map. This also includes places like Puerto Rico and Guam.

    The rip current risks will be provided for the day of and the next day, along with a map showing the highest risk over the next two days. This is really for people who want a more national view of what’s happening.

    Our National Weather Service local office has put out rip current and surf information for years. You can also check out my Sea and Sand video forecasts for Jersey Shore specific information. However, this is a great way to see the risks in one place.

    The National Hurricane Center’s new Rip Current Risk map interface.

    More lead time for undeveloped storms

    June, July, October and November can bring tropical storms or even hurricanes that quickly develop and make landfall on the East Coast. Tropical Storm Fay made landfall at the Edwin B. Forsythe National Wildlife Refuge at the far southern end of Long Beach Island at around 4 p.m. on July 10, 2020. It became a tropical storm just 23 hours earlier. However, the hurricane center knew Fay would hit New Jersey as a tropical storm even before it became a tropical system.

    This update is for situations like this. The National Hurricane Center can issue tropical cyclone advisory products, like forecast updates, watches and warnings, 72 hours before the storm surge or wind hit land, regardless of the storm’s status at the time. Last year, it was 48 hours. So, this is an extension of it.

    Extended wind radius forecast

    The category of a tropical system is based upon the maximum sustained wind speed. However, tropical storm force winds (39 mph or greater) or hurricane force winds (74 mph or greater) can extend for long stretches beyond the core of the storm.

    You have to dig through the hurricane center’s website for it, but they do forecast the size of tropical cyclone wind fields in each of the storm’s four quadrants: northeast (most destructive part), southeast, southwest and northwest).

    In the past, the hurricane wind radius forecasts went out 48 hours. This year, it will go out 72 hours, a testament to the improving accuracy of hurricane forecasting. To find this, search for the “Tropical Cyclone Forecast/Advisory product” when a storm is active. It’s abbreviated as TCM, too.

    Forecast track cone will shrink

    Most of the above updates are due to the impressive work done by the meteorologists at the National Hurricane Center. Hurricane forecasts have become better with time, allowing more useful information to be given to you, with bigger lead times.

    Each year, the hurricane center updates the size of their track forecast error cone. This is based on the accuracy of the storm’s track over the past five years.

    This year, the size of the cone for the Atlantic Hurricane Basin will be smaller at seven of the nine forecast periods from 3 to 120 hours out. This includes all periods 24 hours and later. The most significant will be a 6% reduction in size for the 60-hour and 96-hour forecast.

    How the size of the forecast cone will change for the Atlantic and Pacific Hurricane Basins in 2025, compared to 2024 (National Hurricane Center).

    As an example, a larger cone in 2024 could have Atlantic City on the edge. However, thanks to this improvement, Atlantic City could be out of the cone. That has huge implications for emergency management operations, evacuations and more.

    The forecast cones show where there’s a 66% chance of the storm’s center making landfall. This is important. It does not indicate where the impact of the storm will be, and it’s not guaranteed. Again, though, the National Hurricane Center has made big gains in forecasting the track of tropical storms and hurricanes.

    The official track error trend for Atlantic Hurricane Basin storms. Note the decrease in error since 1990 on all time scales.

    Major update to Hawaii forecasts

    The likelihood of a certain height of storm surge hitting a coastline is now operational in Hawaii. It’ll be initiated by the National Hurricane Center’s Storm Surge Unit and made available within 72 hours of hurricane impacts. Storm surge forecast maps began on the mainland United States in 2016.

    Watch our Interview with the National Hurricane Center Director

    If you go to my YouTube or Facebook pages (@JoeMartWx), catch a special interview with Michael Brennan, director of the National Hurricane Center. It’s all part of the Tidal Flooding Talk show I co-host with Dan Skeldon (a familiar name to many), and Palma Shiles as part of the New Jersey Coastal Coalition. When you have 30 minutes, give it a watch or listen.

  • When is it really beach weather season in NJ?

    When is it really beach weather season in NJ?

    This article originally appeared in Shore Local News on May 22.

    We shivered through our coldest winter in 10 years, held our hats during the windiest winter in 15 years, and lived the rollercoaster temperature ride of spring. Now Memorial Day weekend is here. It’s the unofficial start of summer.

    There’s an old saying for our beach season weekend holidays. It’s some variation of:

    Memorial Day we shiver.

    Fourth of July we sweat.

    Labor Day we shine.

    We all want a fun Memorial Day weekend. It helps our stores make money when visitors and part-time homeowners come back. It’s great for people who want to return to their favorite slice of sand for a few months, and it’s an awesome place for our kids and grandkids to have a good time, and our families to make memories.

    But Memorial Day is in late May, during spring. That means the weather can be unpredictable and change a lot.

    Looking at my Shore Summer Weekend Weather Report Card, the holiday weekend earned an average grade of C-plus between 2019 and 2024. That being said, the past three years all earned at least a B.

    Using climate as our barometer (no weather pun intended), steady beach or boating weather begins in mid-June and ends after the Labor Day holiday, in mid-September. I use criteria from my Shore Summer Weekend Weather Report Card as a guide, with temperatures at or above 75 degrees, winds under 15 mph and a lower risk of widespread rain makers as the main benchmarks.

    Temperatures

    Per the National Oceanic and Atmospheric Administration (NOAA), at Sen. Frank S. Farley State Marina in Atlantic City, the average high temperature hits 75 degrees on June 14. It then peaks at 81 degrees from July 12 to July 27, then it falls, dipping under 75 degrees for the first time on Sept. 15.

    For about three months, it’s usually warm enough to wear a bathing suit and stay outside all day. From July 4 to around Aug. 20, beach weather is nearly guaranteed. There’s an 80% chance the temperature will be 75 degrees or higher, according to the Iowa Environmental Mesonet.

    I checked the weather in Long Branch, Monmouth County, where the monitoring station is about a mile from the ocean. There, the average high temperature is 75 degrees or more from June 6 to Sept. 21. It’s nearly the same as Atlantic City.

    Winds

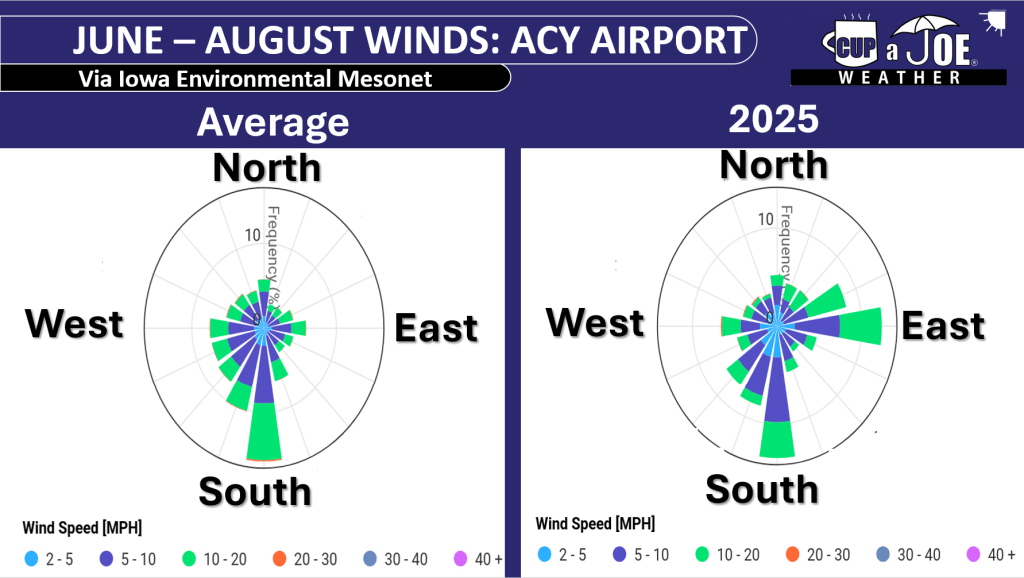
    It’s proven that winds weaken in the summer.Our least windy time of year is July through September, which fits in fairly well with the temperatures. We look to Atlantic City International Airport for this data from the Iowa Environmental Mesonet.

    May: 9.5 mph

    June: 8.6 mph

    July: 7.9 mph

    August: 7.5 mph

    September: 8.0 mph

    October: 8.5 mph

    As the Earth’s axis tilts and the Northern Hemisphere warms, wind-making systems, including nor’easters and powerful cold fronts, stop passing here around mid-June. This lasts through about mid-October.

    Of course there are tropical storms and hurricanes that bring plenty of wind. While we always need to prepare, our likelihood of experiencing one is fairly low. This year, Colorado State University gives New Jersey a 29% chance of a tropical storm, and a 9% chance of a hurricane impacting our coast.

    Steady rain

    From mid-June to mid-October, widespread rain makers are hard to come by here in New Jersey. Just like the winds, the nor’easters and powerful cold fronts, the weather systems that would bring widespread rain don’t impact us this time of year.

    However, this time of year is when thunderstorms happen a lot. They’re most common from June 15 to Aug. 15, based on info from Atlantic City International Airport. A thunderstorm might change your beach plans for a few hours, but the all-day rainy days we see in spring are pretty rare.

    Shifting climate

    Interestingly, the warmest 91-day period of the year has shifted to slightly earlier over the decades. In Atlantic City, here’s the shift, according to the Iowa Environmental Mesonet.

    1900: June 17 to Sept. 16

    1980: June 15 to Sept. 14

    2020: June 14 to Sept. 13

    The average temperature during climatological summer – June through August – increased by 0.65 degrees between 2010 and 2020 in southeastern New Jersey, according to ClimateCentral. Since 1904, the average summer temperature has increased from 71.0 to 74.0 degrees, per NOAA.

    So where can you find true beach weather on Memorial Day?

    Long-term weather averages say that once you go south to Virginia Beach, Va., average high temperatures reach at or above 75 degrees, according to NOAA. That being said, the beaches are better in Jersey, from what I hear.

    Have a great Memorial Day weekend everyone, happy unofficial start to summer and let’s remember all of our fallen United States military members. It’s why we have Memorial Day in the first place.

    Joe Martucci, a Certified Broadcast Meteorologist and Digital Meteorologist, is the President and Director of Meteorology for Cup A Joe Weather and Drone. You can connect with him at cupajoe.live/.

  • Is it warm enough to plant at the Jersey Shore this April?

    Is it warm enough to plant at the Jersey Shore this April?

    Find the original article on Shore Local News here!

    By Meteorologist Joe Martucci

    The old adage goes that in New Jersey, once you get to Mother’s Day you can start planting your gardens. That holds merit. Mother’s Day in the United States is celebrated between May 8 and May 11 (May 11 this year), on the second Sunday in May.

    At Atlantic City International Airport in Egg Harbor Township, there’s an 11% chance that low temperatures will be at or below freezing on or after May 8, according to the National Oceanic and Atmospheric Administration (NOAA). Go to May 14, and that’s happened just twice in the 80-year history of weather records at the airport.

    Cross the bridges to the beaches and your risk of a freeze goes away completely. The latest freeze on record at Sen. Frank S. Farley State Marina in Atlantic City, is April 30. That was back in 1874, the first year of record keeping in the then-young city. Note that the northern Jersey Shore has had freezes as late as May 11. However, there’s only a 7% chance of a May freeze.

    You don’t need to rely on the old adage for your planting advice this season. Your friendly, neighborhood, Shore Local meteorologist can help you with the question of whether or not it’s time to plant this spring.

    Low temperatures on April 18, 2025, the last inland freeze of the spring, so far. (Image via the National Weather Service)

    When was our final freeze of the season?

    Was April 18 the last freeze in the inland parts of the Jersey Shore in the 2025 season? Woodbine (Cape May County), Tuckahoe (Cape May County), as well as parts of Ocean and Monmouth counties dipped below 32 degrees. While Atlantic County did not report a freeze, there was localized patchy frost, which harms young plants as well. At the immediate coast, the last widespread freeze was back on April 9.

    It’s differences like this that we take for granted as residents of the Jersey Shore. Most places in the United States don’t have these kinds of microclimates.

    What is the forecast for the rest of April?

    It’s much more likely that we will go the rest of the month without a killing freeze. The Climate Prediction Center, part of NOAA, was forecasting “likely” above average temperatures for April 26 to May 2 in their April 18 update. With average low temperatures in the mid-40s inland, and near 50 at the coast, you have a better chance of putting your ceiling fan on at night than a killing freeze. I can’t completely rule out frost in the rural Pine Barrens, but this is unlikely.

    How about May?

    The shore will be frost and freeze free. By May 1, we would need a historic polar plunge of cold air. Remember, too, that Atlantic City has never had a freeze past April 30.

    For the inland part of the shore counties, 16% of Mays had a low temperature below 32 degrees. The most recent was May 11, 2010.

    The general weather pattern for the Northeast in the first half of May is a thicker-than-usual atmosphere overhead. The thicker the atmosphere, the more potential for warmer air in the ground.

    Of course, the cold ocean can kick in a chilly daytime sea breeze. However, sea breezes also moderate the overnight low temperature to the warmer side. So the risk of a freeze is low.

    By the second half of May, freezes or frosts in this part of the state are unheard of. After May 15, you’d need a historic cold plunge to get one, and I just don’t see that happening.

    You can plant with confidence now

    Hidden Creek Farm in Stow Creek, Cumberland County, NJ

    If you’re at the beaches, you can start planting if you haven’t already. It’s not unusual to begin planting at this time.

    For inland locations, like Somers Point or Egg Harbor Township, I say go for it and let the fruits and vegetables grow. Farmers planted their asparagus and spinach weeks ago, and they’ll start harvesting in early May.

    When I was growing up in Union County, we used to go to my Nonna’s (grandma in Italian) house to plant corn, plenty of tomatoes and carrots. It was one of my favorite days of the year. Each year, they would let my sister and me plant a fruit or vegetable of our choice. We tried growing watermelons with little success, and sunflowers with better success.

    The plot was about 10 feet by 10 feet, but it felt like a jungle as a kid during the late summer and autumn, with stalks taller than me all around.

    She is still with us, but we decommissioned the garden years ago. However, the memories last forever. I hope you have some of the same this season.

    Joe Martucci, a Certified Broadcast Meteorologist and Digital Meteorologist, is the President and Director of Meteorology for Cup A Joe Weather and Drone. You can connect with him at cupajoe.live/.

  • Powerful new technology shows NJ flood risk through 2100; here’s how

    Powerful new technology shows NJ flood risk through 2100; here’s how

    By Meteorologist Joe Martucci

    View the original article on Shore Local News on April 17 here.

    You may have seen a number of articles come out in the first week of April with headlines like:

    “Rising Sea Levels Will Threaten 323K+ In NJ By 2050, New Study Says: See The Map”

    “Severe coastal flooding could threaten Wildwood, Ocean City, and A.C. by 2050, report says”

    “New Study Projects Climate-Driven Flooding for Thousands of New Jersey Homes”

    What do they actually mean? Why such a flurry of articles from reputable news sources? They sound kind of scary.

    They all come from the release of Climate Central’s Coastal Risk Finder tool on March 31. Climate Central is a nonprofit organization based in Princeton, Mercer County, whose mission is to “address climate science, sea level rise, extreme weather and energy topics.”

    I was fortunate enough to be asked by Climate Central to be a panelist for the public release of the product that Monday. More than 120 journalists and media meteorologists attended the virtual meeting to learn about the tool which forecasts future flooding and its socioeconomic impacts.

    National Flood Insurance Program Policies In Force.

    As of March, there are 200,636 flood insurance policies in force by the National Flood Insurance Program in New Jersey. That’s the fourth highest of the 50 states, ranking just above South Carolina. Furthermore, those policies cover over $50 billion worth of New Jersey property.

    Below is a summary of what the Coastal Risk Finder shows for the present and future of the Jersey Shore, as well as how to use the tool. All of the data is based on an intermediate sea level rise scenario. This scenario lines up best with the options presented by Climate Central, in comparison with what has happened historically in Atlantic City, our primary Jersey Shore tidal location.

    Interagency data from 2022 is the source for sea level rise projections used. Population is based on 2020 levels. To get the most out of the new tool, be sure to use a desktop or laptop computer.

    Not much change in flooding impacts by 2030

    According to the risk finder, 7.9% of people in Cape May County, and 1.9% of people in Atlantic City are at risk of water inundation in their homes at least once in 2030. That’s roughly what it is now. In other words, a flood 2.7 to 2.8 feet above mean higher high water (MHHW) floods the area at least once a year. MHHW is the average height of the two high tides seen per day.

    By 2050, those impacts double in size

    By 2050, according to the risk finder, 14% of people in Cape May County, and 4.8% people in Atlantic County are at risk from either sea level rise or a flood that happens once a year, on average.

    This indicates a flood 3.2 to 3.4 feet above mean higher high water in Ocean City, which would involve most areas bayward of West Avenue, from Second Street to 18th Street. Compare that to 2030, where only areas bayward of West Avenue, from Third Street to Eighth Street, would be underwater.

    Places that would flood once a year.

    Our kids and grandkids could be at serious risk

    Lastly, we’ll look at 2100. While most of us probably won’t be alive (I would be 109 then), our kids and especially grandkids would be around. That projects a vastly higher number.

    According to the risk finder, 35% of people in Cape May County, and 16% in Atlantic County would flood at least once a year. When considering just the shore towns, that number jumps to at least 65% of Ocean City and the Downbeach towns would flood during a flood that’s 5.2 to 6.1 feet above MHHW.

    Using Ocean City again, nearly everywhere bayward of Central Avenue would experience floodwater at least once a year. That’s nearly all of the island. Most of the Ocean City Municipal Airport would be included in that, too.

    What else to consider

    Your town’s emergency managers, elected officials and administrators take pride in protecting your property from floodwaters. The New Jersey Coastal Coalition, for which I do work, brings communities up and down the Jersey Shore together to share common sense flooding solutions. The result has been a reduction in your flood insurance premiums.

    Ocean City is eligible for a 30% rate reduction this year. Longport, Linwood, Margate and Ventnor have all earned 25% off. Somers Point has earned 20% off.

    All of this is through the Federal Emergency Management Association’s Community Rating System (CRS) program. Through a combination of public information, mapping, regulations, flood damage reduction, as well as warning and response programs, your communities earn points toward rate reduction. For example, Avalon saved residents $1.6 million in 2020, and each year going forward, by going up a class rating.

    The data and projections shown on the Coastal Risk Finder do not take into account future actions your town will take to increase their CRS score. It also doesn’t consider other actions being considered by towns and the state such the NJ Resilient Environments and Landscapes program.

    How to navigate the Coastal Risk Finder

    First go to www.climatecentral.org. Then go to Tools and select “Coastal Risk Finder” from the dropdown.

    On the left-hand side, you’ll be able to select your town, county or state. You can then select your scenario. You can view the risk by year, good for viewing what sea level rise projections will bring. Or you can view the risk by water level, which you could use to see how another Superstorm Sandy (search for 4 or 5 feet) would flood somewhere now.

    If you select the risk by year, you then go to additional settings to find your scenario.

    For purposes of this article, I used the sea level rise + annual flood under “projection type.” Then, for “sea level protection source” I used U.S. Interagency 2022.” Then I clicked on the “intermediate” sea level scenario.

    Joe Martucci, a Certified Broadcast Meteorologist and Digital Meteorologist, is the President and Director of Meteorology for Cup A Joe Weather and Drone. You can connect with him at cupajoe.live/.

  • April Snow at the Jersey Shore: How often does it happen?

    April Snow at the Jersey Shore: How often does it happen?

    By Meteorologist Joe Martucci

    This article appeared in the April 3rd edition of Shore Local Magazine, which you can find here!

    April showers bring May flowers, as the saying goes. But what about April snow showers? Some April snow is common at the Jersey Shore, but don’t expect the plows to pass by the blooming cherry trees.

    Snow is tough to love, especially the older you are. I visited a homeschool group at Lakewood Chapel in Mays Landing on March 26. When I asked who liked snow, most of the children raised their hands, with a few parents agreeing. But most of the parents didn’t like the snow.

    With the arrival of spring, this story plays out often for me, too. April snow especially has a face only Mother Nature could love. (Let me know how you feel about April snow on my social media pages).

    Personally, I love snow until St. Patrick’s Day. Then I’m done with it. However, I could make an exception for record-breaking April snow.

    How often does the Jersey Shore have snow in April?

    For inland parts of the shore counties, 15% of Aprils have had measurable snow, at least 0.1 inches of snow or greater. The most recent time this happened at Atlantic City International Airport was on April 9, 2016. Totals that day, reported via CoCoRaHS, were downright weird.

    Snow on April 9, 2016 up the coast in Monmouth County (Via Justin Godynick)

    First, any measurable snow in April is uncommon. But this was a South Jersey snow special. Ocean City reported 3.2 inches of snow. Estell Manor saw up to 2.9 inches of snow, according to the Office of the New Jersey State Climatologist. Central and northern parts of the state barely had accumulation, even on grass.

    Snowfall totals from the April 9, 2016 Snow (Via the Community Collaborative Rain, Hail and Snow Network)

    The Sen. Frank S. Farley Marina in Atlantic City hasn’t kept snow records since 1956. However, looking at the short term, current data in Margate suggests that measurable April snow in the beach towns has a 5-10% chance of occurring in a given year. Longer-term data in Lower Township also supports this probability. For reference, the northern part of the Jersey Shore jumps up to around 20%.

    This all being said, April flurries are common. You can go for a few years in a row with a few festive flakes floating in the spring sky.

    Has it snowed enough to be plowable?

    For the purposes of this question, we’ll assume that 2 inches of snow is plowable.

    Since snow records at Atlantic City Airport began in 1945, there have been only six April days with at least 2 inches of snow or more. In Margate, there has only been one time since records started in 2000 when this has occurred.

    Even in a cooler climate period, the Sen. Frank S. Farley Marina in Atlantic City only had three such days during their 1884-1956 snow record-keeping period. All records come from the National Oceanic and Atmospheric Administration. In other words there has, and continues to be a less than 1% chance the snowplows will come around in any given April at the shore.

    What year produced the most April snow?

    Since measurable April snow is uncommon, and plowable snow is rare, the Aprils with the most snow are largely driven by one day of snow.

    At ACY Airport, 1996 saw the most April snow – 5.7 inches of snow fell that year. However, all of that fell on April 9.

    Margate’s highest April snow year was 2016 with 2.0 inches. Again, April 9 was the day when all of that fell at once. Another way to look at it is the April with the most days of accumulating snow.

    ACY Airport saw two days of measurable snow in April 1956, 1959 and 1983. Lower Township had two days back in 1907. Meanwhile, Margate only had snow accumulate in April once – in 2016.

    Biggest April snows

    Here’s a look at the three biggest April snow totals up and down the Jersey Shore.

    If you’ve lived in the shore counties your whole life and are over the age of 14, you should remember the 2016 snow.

    May snow?

    The Jersey Shore never had measurable snow in May during its period of record. Non-accumulating flurries are uncommon, but not rare. I remember when flurries flew on Mother’s Day weekend back in 2020.

    Hurricane season forecasts

    On the completely opposite side of the weather spectrum, the first hurricane season forecasts will come out this month.

    It kicks off on April 3 when Colorado State University releases its outlook for the season. Despite the state being landlocked, it was home to William Gray, widely considered the pioneer of this specialized weather field.

    The Weather Channel typically releases its hurricane forecast during the first half of April. So, be on the lookout for that.

    Then, the National Hurricane Center will release its forecast in late May. The Hurricane Center manages all tropical watches, warnings and storm-specific forecasts in the United States.

    As we go deeper into spring, stay tuned for a few hurricane-related articles here.

  • NJ’s drought improves but path to drought-free will get tougher

    NJ’s drought improves but path to drought-free will get tougher

    By Meteorologist Joe Martucci

    This article ran in Shore Local Magazine on March 27th. The original article had data through March 21 (read here). However, this version is updated to the 27th.

    Mother Nature has made up for lost time, bringing plentiful rain to the state since March 5. That’s led to three consecutive weeks of improved drought status, according to the United States Drought Monitor.

    The improved status is clearly visible in the latest update (dated March 20) from the United States Drought Monitor.

    From New Year’s Day through March 4, 3.81 inches of rain fell at Atlantic City International Airport in Egg Harbor Township. The report came from the National Oceanic and Atmospheric Administration. From March 5 until March 21, 5.55 inches of precipitation fell.

    The Sen. Frank S. Farley State Marina in Atlantic City saw a similar increase, recording 5.21 inches of precipitation March 5-21. Before that, it was 3.44 inches since the year began.

    It’s not just Atlantic County. Longtime weather reporting stations in Long Branch (Monmouth County), Trenton (Mercer County), and Philadelphia all saw as much or more precipitation since March 5. This is compared to the previous 64 days of the year.

    The weather pattern favors more storminess through the first week of April. So the shore should continue to see steady or improved drought status. However, improvement for the rest of the spring is considered unlikely. We will say more about that in the moment.

    On March 20 the South Jersey shoreline, from Stafford Township and Long Beach Island on south, improved from extreme drought. This was a level three of four drought. It improved to a severe drought, which is a level two of four. That’s our lowest level since Nov. 5, 2024.

    Inland Atlantic County (west of the Garden State Parkway), was still in extreme drought, though. Those areas join most of Cumberland County, and a small portion of inland Cape May County. This is the only area east of the Mississippi River in significant drought, as my friend and New Jersey State Climatologist Dave Robinson texted me last week.

    Still, New Jersey’s drought is improving. The 7% of the state in extreme drought is the lowest since Oct. 29, when the state was in the midst of its historic driest month on record.

    Drought status between December 10, the peak of the drought, and March 20, in New Jersey (United States Drought Monitor)

    The waning days of March, and the beginning of April bring plenty of opportunities to improve drought even more.

    The Climate Prediction Center, part of NOAA, gives a lean toward wetter conditions around our area through April 4. That’s because the jet stream – the river of air about 30,000 feet high – will be over or around New Jersey during this time. Think of the jet stream as the storm track, with a colder air mass to the north and warmer air mass to the south. This is in part a reaction to the polar vortex entering the Northeast last week, which I talked about on social media if you follow me there.

    We’ll take what we can get. In March, 0.75 inches of rain a week generally keeps us from slipping further into drought. Over an inch, like we’ve seen for most of March, will improve drought’s status.

    However, once we go into April, water usage increases. The sun evaporates more water out of the ground as it goes higher in the sky. We’ll need an inch per week just to keep up, with over 1.25 inches a week to improve drought. These need to be region-wide soakers, too.

    Sure, 3 inches of rain in Linwood from pop-up thunderstorms is great. However, in order for the Kirkwood-Cohansey Aquifer, from which southeastern New Jersey gets its drinking water, and reservoirs for the rest of the state to recharge, we’ll need rain from a coastal storm or a large inland low-pressure system.

    As of March 25, levels in the Manasquan Reservoir were at about 84% of capacity, according to the New Jersey Water Supply Authority. Typically, 97% is the average for March, according to the agency.

    The underlying data still shows there’s work to be done. As of March 23, average stream flows over the past 90 days are still in the “extremely dry” category up and down the Jersey Shore. In the southern part of the shore, it’s been this way for 23-straight weeks.

    I took a deep dive into the Climate Prediction Center’s outlooks. They break it down into three-month periods.

    The way I read it is I should expect a more humid-than-usual summer. That will at least increase the probability of pop-up thunderstorms. That’s good news, but again, we’ll need widespread rainmakers, which are unlikely in our climate once we hit mid-June. Rain storms from tropical cyclones don’t make their way here until late July, usually.

    In a bit of good news, there is a small lean toward wetter weather than usual here. A remnant storm or two would do wonders for us. We failed to get any last fall, which led us into this drought anyway.

    In my opinion, the best case scenario is that drought doesn’t worsen over the next few months. Then we get a tropical cyclone or two to pull us back to normal.

    The worst-case scenario: The extreme drought (level three) expands back to the Jersey Shore. The state would seriously need to consider their first drought emergency since 2002, and the mandatory drought restrictions that come with it, later in the spring.

    The NJDEP issued a statewide drought warning last November which called for voluntary water restrictions.

  • We lived through the Jersey Shore’s windiest winter since 2010-2011

    We lived through the Jersey Shore’s windiest winter since 2010-2011

    By Meteorologist Joe Martucci

    This article appeared in Shore Local Magazine on March 20th. Read the story here, also!

    No, it wasn’t just you thinking the wind was howling this winter. This was the windiest winter since 2010-2011, and featured the second highest wind gust on record.

    At Atlantic City International Airport, the average sustained wind speed from December through February (climatological winter) was 9.7 mph, according to the Iowa Environmental Mesonet. During the winter of 2010-2011, that number was 10.3 mph.

    It’s not just the airport. Toms River (8.1 mph) was the windiest since 2010-2011. Meanwhile, Lower Township, at Cape May County Airport, was the breeziest since the winter of 2017-2018 (9.0 mph), according to the Mesonet. The top wind gust all winter was 71 mph at Atlantic City International, which occurred Feb. 16. That was the second strongest gust during climatological winter since records began in 1944.

    The breezy weather lasted beyond climatological winter. Atlantic and Cape May counties had the most wind advisories. They either led or tied for the most issued by the National Weather Service this year up to March 14. (A wind advisory is issued when wind gusts are forecast to hit 46 to 57 mph, or steady winds will be 31 to 39 mph).

    The number of wind advisories issued by the National Weather Service for the coastal part of Cape May County (National Weather Service).
    The number of wind advisories issued by the National Weather Service for the coastal part of Atlantic County (National Weather Service).

    Wind speeds this past winter were more significant than in recent years. However, they were still within the normal range for the period of record. Similar to temperature trends, it was ultimately a seasonable winter for wind speeds.

    Since the 1970s, winds have gotten slower at Atlantic City International Airport, according to the Iowa Environmental Mesonet. The winds we felt in the winter of ’24-’25 were calmer than what was normal before the 1980s. Back in the middle of the last century, winter winds usually blew faster than 11 mph. That’s about 20% stronger than the winds we have now.

    A wind speed graph at ACY Airport over time
    Average wind speed, by year, at Atlantic City International Airport (Iowa Environmental Mesonet)

    It’s not just ACY that has lighter winds these days. I checked two other airports with long records. At Monmouth Executive Airport in Wall Township, the winds have been slowing down little by little over the last few decades. But at Millville Municipal Airport, where they started keeping track just a few years after Atlantic City, the winds have dropped significantly since the late 1990s.

    In Millville, the sharp decline can be explained. In 1999, the weather equipment was moved from the eastern side of the airport to its current location on the western side, according to NOAA. There is an area of trees about 350 feet south of there. While they meet the standard practice of being at least 100 feet away from trees, this still likely weakens southerly winds. These winds encounter the anemometer equipment used to measure wind speeds.

    a map of Millville Airport
    The positions of the weather station at Millville Executive Airport. The 3 indicates it’s location up until 1999. It then moved west to its current location, marked by the number 1. (Google)

    At ACY Airport, there’s no clear year in the data that shows the weather equipment moved and caused lower wind speeds. The biggest drop seems to have been in 1978.

    The airport moved its equipment in 1968 and 1995, but the wind speeds didn’t really change much before or after those years. However, there was no location change then, according to NOAA. There was no major equipment change, either. I asked the National Weather Service for an explanation but could not find one. Monmouth Executive Airport’s weather station also doesn’t have any equipment or location explanation for the lower winds.

    There is research supporting the idea. Winds have been getting weaker in recent decades in the Northeast, away from the beach towns.

    “We show that surface wind speeds have declined by 5-15% over almost all continental areas in the northern mid-latitudes, and that strong winds have slowed faster than weak winds,” stated Robert Vautard, research director at the French National Centre for Scientific Research in a 2010 research article. The article looked at the period from 1979 to 2008.

    Vautard argues that a combination of reforestation and urbanization has played a large role in this. To a lesser extent, a weaker jet stream contributed. This jet stream is a river of strong winds about 30,000 feet high that separates two air masses.

    Urbanization makes sense. Atlantic County has grown a lot – 56% more people since 1970, according to the United States Census. Monmouth County, where the executive airport is, grew by 39%.

    The forest idea works, too. Around the late 1970s, when the winds started slowing down, the Pinelands National Reserve was created. This stopped people from building there, so the forest got thicker. Thicker trees block the wind and slow it down. Atlantic City Airport isn’t in the Pinelands, but it’s close enough that it might matter.

    Even so, this winter was pretty windy. There were 11 days when the wind stayed above 15 mph this winter.

    The last time it was windier was back in 1991-1992.

    However, in the 1960s and 1970s winter would have been the calmest season of the whole year. Even in the 2000s, you would consider the season’s breeze average.

    Similar to this past winter’s temperatures, which were the coldest in 10 years, the wind was noteworthy, but in the grand scheme of things, similar to what we used to see. Mother Nature must have had nostalgia for winters past this season.

  • The coldest winter in 10 years just froze N.J.

    The coldest winter in 10 years just froze N.J.

    By Meteorologist Joe Martucci

    This story first appeared in Shore Local magazine on Mar. 6. Read it here!

    Climatological winter – December, January and February – is over, and the latest data shows that this was the coldest since 2014-2015 for the Jersey Shore.

    The average temperature was 34.8 degrees at Atlantic City International Airport in Egg Harbor Township, and 36.4 degrees at the Sen. Frank S. Farley State Marina in Atlantic City.

    What stood out the most to me was how long the cold lasted. December, January and February were all colder than normal, according to the National Oceanic and Atmospheric Administration (NOAA). The only exception was February at the airport, which was exactly average for the season. Note that average here means the 1991-2020 universally used time. We’ll talk more about that later.

    Monthly temperature departure from average

    Here’s the Monthly Temperature Departure from Average in degrees Fahrenheit, according to NOAA:

    December was -1.0 at the airport and -0.9 at the marina.

    January was -3.5 at the airport and -3.7 at the marina.

    February was 0.0 at the airport and -0.2 at the marina.

    It truly felt like a start-to-finish winter at the Jersey Shore. This has become less and less common over the decades.

    While all three months were at or colder than average, that conclusion is based off of the mean temperature from 1991-2020. Looking back at all of recorded history shows that this winter was more in line with an average one than a frigid one.

    Yes it was cold, but…

    Take Atlantic City International Airport. Out of the 82 winters on record, this winter ranked exactly at the halfway point between them all. Taking it a step further, the average temperature for the entire period is 35 degrees, just 0.2 degrees above this past winter’s temperature.

    Go to the beach and we have Atlantic City Marina, one of America’s premiere weather reporting stations. It has had nearly continuous record keeping since 1873 – one of the country’s longest established weather outposts. Plus, situated right at the marina, its data reflects the true impact of the water on the shore’s climate.

    This was in the colder half of the 150 winters on record, but not by much. It was the 68th coldest, putting it in the top 45%. The long-term average is 36.1 degrees, which is actually slightly colder than what we just experienced.

    Neither Atlantic City International Airport nor Atlantic City Marina set any new cold temperature records. The last time either place had record cold, for high or low temperatures, was in 2022, according to the Iowa Environmental Mesonet.

    The only new record was in Estell Manor, Atlantic County. On Feb. 19, the highest temperature of the day was just 30 degrees, the coldest ever for that date. Records there go back to 1966. While it’s not as well-known for climate data as the airport or marina, it still provides useful information.

    Overall, this winter wasn’t extremely cold when looking at all past records. But compared to recent years, it was colder than usual – the coldest since the winter of 2014-2015.

    Frozen waters

    Ice is visible well off the shore on the Beach Thorofare in Atlantic City during January, just off of West End Avenue. (Photo by Joe Martucci)

    The salty bays had some ice on them from late December to mid-February. In some places, the ice stretched far out into the water.

    Ice was especially extensive on Jan. 24. Most of the Delaware Bay had a total ice concentration of 90%, according to the United States National Ice Center. Even on the Atlantic Ocean side, there was some ice in Cape May County.

    The Delaware Bay shoreline, from roughly Del Haven, Middle Township, over to East Point Lighthouse was at least 90% iced over on Feb. 21, according to the United States National Ice Center. At least some ice covered nearly the entire Delaware Bayshore that day, too. That extended up the river to Philadelphia.

    The freshwater ponds were frozen over for a long while this winter. Pictures on social media of people playing pond hockey, skating or even ice sailing were seen up and down the Jersey Shore. Furthermore, the cold reversed the trend of plants and trees budding in mid to late February.

    Why was it so cold?

    The reason for the coldest winter in nearly a decade has to do with two factors: the polar vortex and the cold ocean.

    The polar vortex is a cold dome of low pressure in the stratosphere. It sits over the poles in its resting state. This winter, it stretched down into the northern United States numerous times. As of the end of the month, it occurred 10 times, according to Judah Cohen of Atmospheric and Environmental Research (AER) in Massachusetts. For those keeping score at home, that’s a lot.

    When that happens the jet stream – the river of air about 30,000 feet high that separates colder and warmer air masses – will dive toward the equator about 10 to 14 days after the polar vortex moves in.

    The polar vortex and jet stream can stretch down to the equator anywhere in the Northern Hemisphere it wants. However, this winter, it was locked into the northern tier of the United States, as well as far eastern Russia.

    Typically, stretched polar vortexes bring less bitter cold than a split polar vortex (when the polar vortex breaks into two). However, with it occurring 10 times it brought a persistent cold.

    The second thing that affected the weather was the cold ocean. It made the air chilly at the Jersey Shore. The Atlantic City Marina was much colder than usual compared to Atlantic City International Airport.

    The ocean water was colder than normal this winter. It was 45 degrees in December, 40 degrees in January, and 39 degrees in February, says the National Oceanic and Atmospheric Administration. Also, the bays were super cold, even below 32 degrees for a while.

    The drought continues

    In addition to temperatures, we have to talk about precipitation. We did not get the rain or snow needed to pull us out of drought. In fact, in my winter outlook I said the following:

    “There should also be an average amount of storminess… Drought should recede during the winter, but I don’t believe it’ll be enough to cure our problems as we exit the season. Looking ahead, we’ll need a wetter-than-average spring to end the drought for good. Otherwise, there will be water problems.”

    That was true for New Jersey as a whole. However, for the South Jersey Shore, “extreme drought” lasted all winter long, according to the United States Drought Monitor. That’s the third level with level four being the worst. Statewide, most of the northern half of the state dropped from level two to level one for drought. This change occurred by the Feb. 27 update.

    Precipitation over the three months was between 6.18 inches at Atlantic City Marina and 8.70 inches in Galloway. This is for Atlantic and Cape May counties based on data from the National Oceanic and Atmospheric Administration. That’s 26% to 50% below average.

    Snowfall ranged from a little below average in Atlantic County to a little above average in Cape May County. Margate was the lowest at 10.3 inches. Lower Township was the highest at 17.5 inches. I’ll have a full snow season recap later in the month.

    Looking ahead

    March does not look like a very wintry month. After the frigid cold on March 2-3, temperatures will mostly be at or above average. This trend is expected through the middle of the month. Think highs in the 50s and 60s, cooler at the beaches as the daily, chilling sea breezes return.

    Cohen from AER believes one more shot of colder-than-average temperatures will arrive in the second half of March. If it does, we’re likely talking highs in the 40s and lows in the 20s. That’s more of the typical wintertime cold, nothing exceptional.

    In terms of precipitation, there’s no strong lean toward a wetter- or drier-than-average month. Getting a normal amount of rain would be helpful. March is the wettest month of the year at Atlantic City Marina with 4.27 inches of rain. It’s the second-wettest month at Atlantic City International Airport, with 4.52 inches. That much rain would stop the drought from getting worse, but it wouldn’t make it better.

    By St. Patrick’s Day, we’ll need about an inch of rain each week. This is necessary to make up for the water that dries up from the ground. It’s also for the water that people use. To get ahead, we would need at least 1.25 inches a week.

  • South Jersey: The Unexpected Snow Capital of NJ

    South Jersey: The Unexpected Snow Capital of NJ

    Read the Feb. 20 article in Shore Local News here!

    NOTE: This article came out on Feb. 20 but was written on Feb. 14. As we know, there was no snowy nor’easter in New Jersey this week. That stayed in Virginia. This article is modified to adjust for that.

    With two South Jersey Snow Specials down and another one possibly on the way, our area could beat out the typically snowy, hilly northwest New Jersey for the snowiest place in the Garden State.

    As of this writing, we didn’t know what would happen with a nor’easter anticipated on Feb. 20, but it turns out it brought a record snow to southeastern Virginia. Meanwhile, only Cape May City saw coatings. There was no third South Jersey Snow Special.

    However, Jan. 6 saw Wildwood Crest’s 8-inch report as the highest snowfall total in the state. 4 to 6 inches of snow fell in places like Ocean City, Somers Point and Margate, too. Meanwhile, once you went north of the White Horse Pike, snowfall totals were generally below 2 inches.

    Then, on Feb. 11-12, it happened again. In an all-snow event, Cape May was in the top spot with 8.8 inches of snow. However, more than 6 inches of snow fell in eastern Atlantic County, as well as all of Cape May County; 8.1 inches were measured by Dan Forshaw in Somers Point, a volunteer weather observer for the Community Collaborative Rain, Hail and Snow Network (CoCoRaHS). In Ocean County, 6 inches fell as reported by another CoCoRaHS spotter.

    It’s rare for the southeastern part of New Jersey to get more snow than the usually snowier and colder northern areas of the state.

    Since the winter of 1939-1940, there have been eight times when either the Cape May area or Atlantic City International Airport got more snow than other major weather stations in New Jersey. These other stations are: Trenton, New Brunswick, Newark, and Belvidere. This information comes from the National Oceanic and Atmospheric Administration, or NOAA.

    Here’s a look at those winters, along with the location of the snowiest place and how much snow they received. All data are measured in inches.

    1939-1940: Cape May area, 28.1.

    1967-1968: AC Airport, 18.5.

    1978-1979: AC Airport, 43.1.

    1988-1989: Cape May (Lower Twp.), 21.2.

    1989-1990: AC Airport, 23.0.

    2009-2010: AC Airport, 58.1.

    2021-2022: AC Airport, 33.3.

    2024-2025 (thru Feb. 15); AC Airport, 13.8.

    If it happened before, then this winter has the possibility of doing it again.

    There are specific reasons why each winter had more snow here than the rest of the state. They can be grouped into a few categories.

    This winter, just like in 2009-2010 and 1988-1989, the storms that make snow are coming from so far south that our area is getting the most of the snow in New Jersey. When you go north, you get too far from where the storms are so places like Belvidere or Newark didn’t get much snow because it was too dry there.

    The winter of 2021-2022 had that as well. A storm on Jan. 3, 2022 brought over 8 inches of snow to the South Jersey shore. Meanwhile, north of Interstate 195, there was no measurable snow.

    However, later in the month, the Blizzard of 2022 happened on Jan. 28-29. The storm track was so far east that the Jersey Shore saw the most precipitation. Twelve to 20 inches of snow fell here, but Atlantic City International Airport only picked up 16 inches of snow. Meanwhile, Trenton and Belvidere saw less than half of that.

    Some were just luck. The winters of 1967-1968, 1978-1979, and 1989-1990 all saw about the same amount of snow throughout the state. However, Atlantic City International Airport or the Cape May area saw just a little more than the others.

    We need to wait and see how much snow we get from the anticipated Feb. 20 nor’easter. I think it’s possible for the South Jersey shore to get more snow than other parts of New Jersey this winter. However, we’ll need one more South Jersey Snow Special to do so.

    Temperatures are expected to be colder than average for our area from Feb. 22 through the middle of March, according to NOAA’s Climate Prediction Center. While that doesn’t guarantee snow, that’s a help.

    On the other hand, the forecasts for the upper-level weather pattern suggest that winter storms will take a more northerly track. It could be that when it’s cold enough for snow, it’s dry, or when a storm arrives, it warms up. That would mean less snow here compared to climatologically snowier spots farther north in the state.

    Plus, as we deal with every year, our snow season is just shorter. Our average last measurable snow in Lower Township is March 2, according to NOAA. At Atlantic City International Airport the average is March 6. Trenton, Newark and Belvidere’s are all at least 12 days later. That gives these locations a longer runway to make up their snow deficit.

    Ultimately, we are progressing well to once again create history in this region of the Garden State, but assistance will be required to achieve this goal.

    If you have a small open space on your property and like weather, please consider joining CoCoRaHS. See https://www.cocorahs.org/application.aspx

    Joe Martucci, a Certified Broadcast Meteorologist and Digital Meteorologist, is the President and Director of Meteorology for Cup A Joe Weather and Drone. You can connect with him at cupajoe.live/.