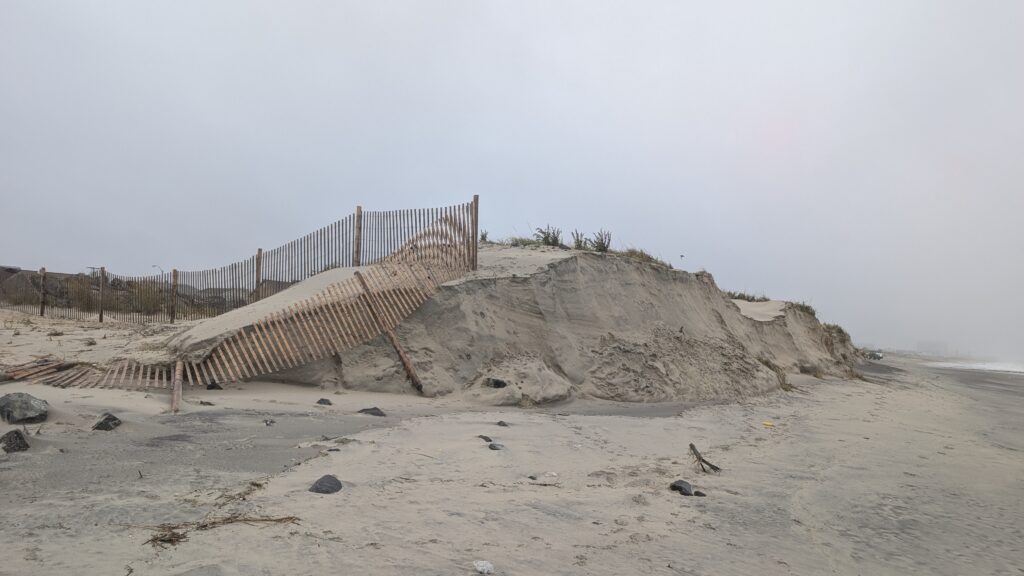
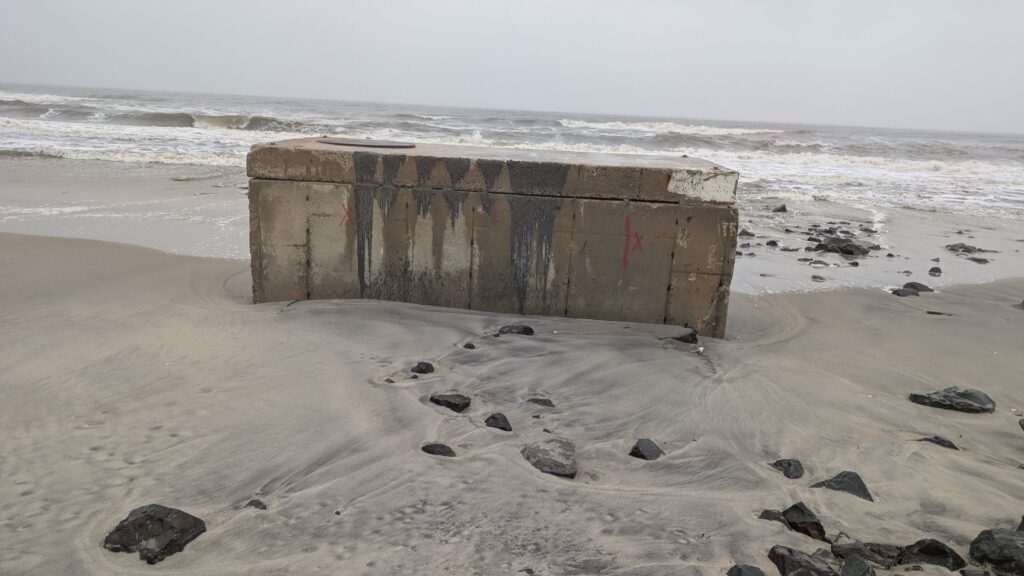
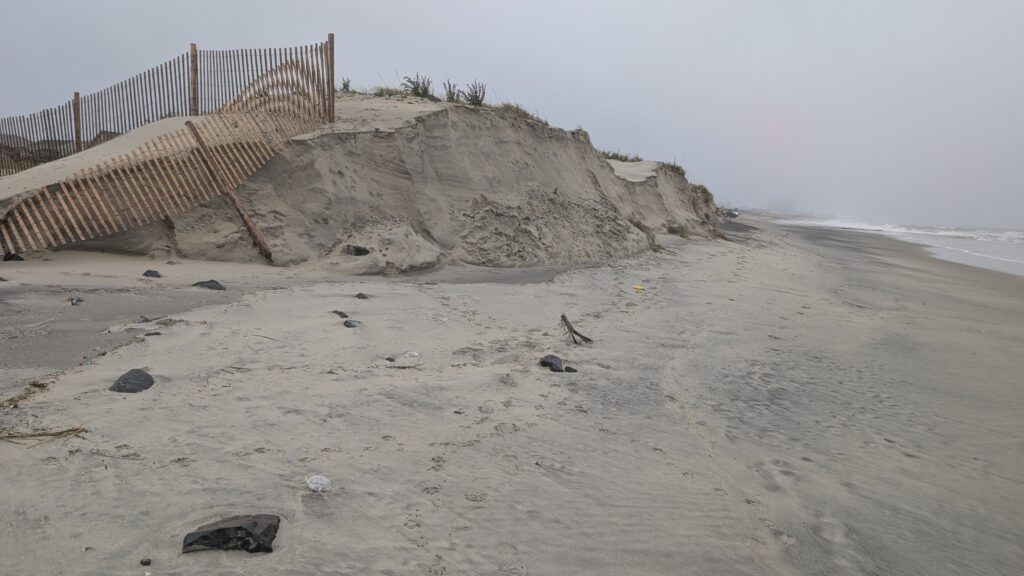
AVON NOR’EASTER DAMAGE | I walked over to the beach here in Monmouth County. The north side of town had its beach eroded big time.
There’s an 8 foot cliff of sand by the outfall pipe. The sand fences are knocked over, with the sand eroded away.
New Jersey has another 7 months until nor’easter season ends. That’s a lot. Some protective dunes remain, which is good, but another one of these puts that in serious jeopardy.
NOTE: This story was originally published on April 4. It was updated on Sept. 16 to account for the “super” El Nino declared by NOAA.
Goodbye La Niña and hello El Niño – a “super” El Niño.
A “super” or very strong El Nino became official on Sept. 14, 2026 per NOAA’s update. This shift in the Earth’s long-term weather patterns will define how we experience the upcoming hurricane season, as well as the snow and cold of next winter.
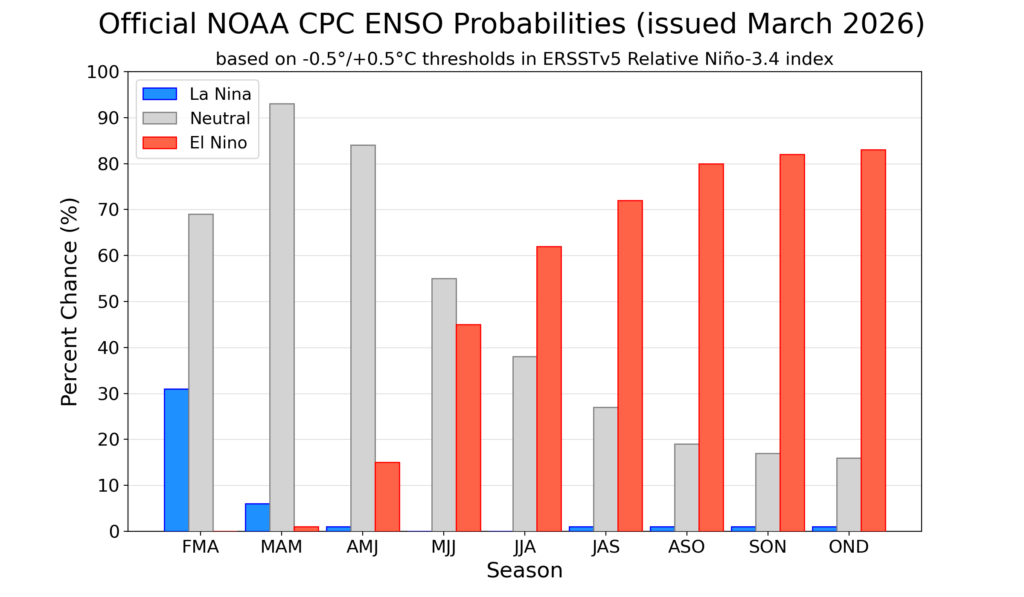
Forecasters from the National Oceanic and Atmospheric Administration give El Niño a greater-than-60% chance of developing during the summer. By the fall, during the peak of hurricane season, it’s an 80% chance.
By July, the chances of an El Nino developing are over 50% (via NOAA)
El Niño or La Niña is part of the El Niño Southern Oscillation (ENSO). This refers to the water temperatures off the Equatorial Pacific Ocean, from roughly Peru westward 7,000 miles. When water temperatures are warmer than average, it’s El Niño. When it’s cooler than average, it’s La Niña.
Via NOAA
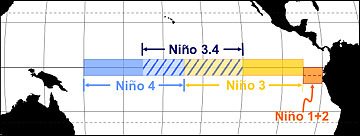
Meteorologists break this down into four different zones within the ENSO region. I won’t explain it much here, but where those warmer temperatures are this summer and beyond will make a slight difference in what our long-term forecast will be.
Since the summer of 2024, we have been in La Niña. That typically means milder winters. However, both the 2024-2025 winter, and this past winter, were colder than average.
The frozen tundra of snow and ice we experienced for weeks this past winter bucked the La Niña trend, too. For hurricane season, 2024 was more active than usual, while 2025 was about average. That checks out with a La Niña pattern.
Let’s look at what El Niño will mean for both the 2026 hurricane season, and the 2026-2027 winter, plus what a “super” El Niño could mean for New Jersey.
Quieter hurricane season likely
When El Niño is present, hurricane activity in the Atlantic Hurricane Basin goes down; it’s that simple. The Atlantic Hurricane Basin averages 14 named storms – seven hurricanes including three major hurricanes (Category 3, 4 or 5) per season, per Colorado State University. Since 1990, there have been 11 hurricane seasons with El Niño. Seven were less active, while two were about average and two were more active.
More than likely, this hurricane season will be as active or less active than average. With a 24% chance of the eye of a tropical storm or hurricane being within 50 miles of the Jersey Shore, that number should be lower as well. Hurricane season officially runs from June 1 to Nov. 30.
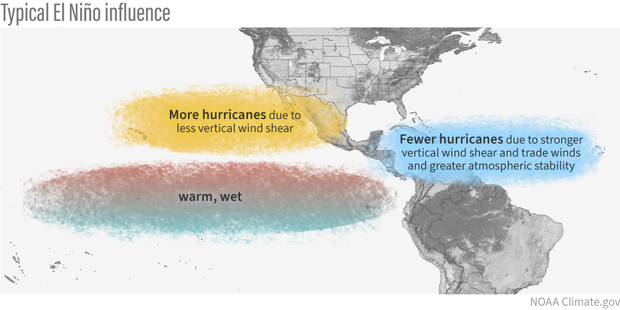
During El Niño, there is stronger windshear in the tropical Atlantic Ocean. Windshear is a change of wind direction or speed as you go up from the surface. This, in short, rips apart developing cyclones.
Winter temperatures
The stronger the El Niño, the warmer the temperatures. By itself, El Niño doesn’t mean much for our temperatures during the winter. Since ENSO records began in the 1950s, winters with El Niño end up about average at Atlantic City International Airport and the Sen. Frank S. Farley State Marina in Atlantic City.
However, when you look at the intensity of the El Niño, the pattern becomes clear.
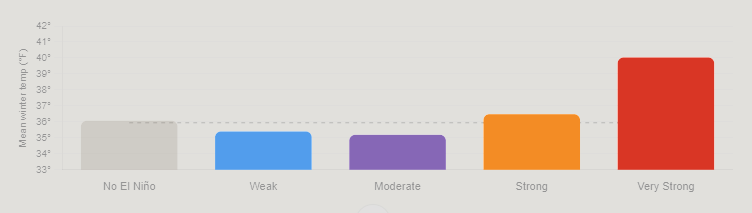
Very Strong: 4.0 degrees warmer than average
Strong: 0.5 degrees warmer than average
Moderate: 0.7 degrees colder than average
Weak: 0.5 degrees colder than average.
Mean temperature between December and February for Atlantic City International Airport and Sen. Frank S. Farley State Marina in Atlantic City, based on the intensity of the El Nino (graphic is from Claude Artificial Intelligence, via NOAA data).
The stronger the El Niño, the warmer the temperatures. That’s because the Pacific jet stream – the river of air about 30,000 feet high that separates two airmasses – pushes into the Northeast. That means more opportunities for us to be south of the jet stream, taking in milder air.
Winter snow: One clear signal
Like winter temperatures, using El Niño alone doesn’t produce a big trend in what snow could look like for a winter. Generally, it’s a little less snowy than average. However, when you look at the type of El Niño, there is a trend that screams off the chart.
When El Niño is in a moderate phase, it’s 13 inches snowier than average. For the South Jersey shore, that’s 25 to 30 inches of snow. Farther up the coast, that’s roughly 30 to 35 inches of snow.
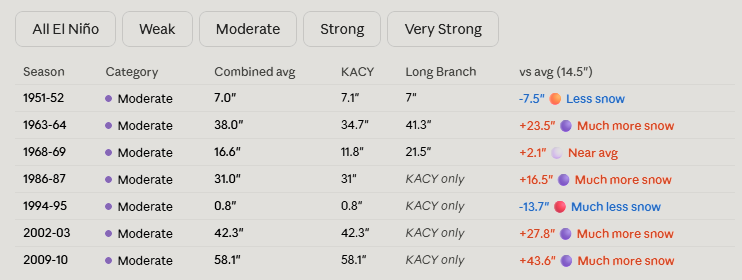
Here’s the snow breakdown for Atlantic City International Airport and Long Branch, by El Niño phase.
Weak: 3.5 inches below average
Moderate: 13.2 inches above average
Strong: 3.4 inches below average
Very strong: 0.2 inches above average
Winter snowfall totals for the Jersey Shore, based on the intensity of the El Nino (graphic is from Claude Artificial Intelligence, via NOAA data)
The last two moderate El Niño winters were 2009-’10 and 2002-’03. Both brought plenty of snow, and winter storms. That included:
On Feb. 5-7, 2010, over 20 inches of snow fell roughly south of the Atlantic City Expressway. Meanwhile, New York City experienced less than 4 inches of snow.
A few days later, the Feb. 9-11 winter storm brought over half a foot of snow to the shore.
The Feb, 16-18, 2003, winter storm, known as the President’s Day II or PDII storm, dropped over 18 inches of snow on much of the Jersey Shore and ranks as the sixth strongest winter storm on NOAA’s Northeast Snowfall Impact Scale.
Moderate El Niños sit in a weather sweet spot for winter storms in New Jersey. They enhance the jet stream’s pattern in a way that funnels nor’easters up the coast without warming the region enough to flip precipitation to rain.
WEDNESDAY’S FORECAST | It’s bright and breezy today! Sand will whip around on the beach. Otherwise, we’re on a rollercoaster ride of humidity. It’s one that will bring some showers/storms for Thursday and even Friday. I’ll tell ya when it’s dry.
JennyPennyWriting.com brings the latest and greatest interviews that are NEVER bought or paid for.
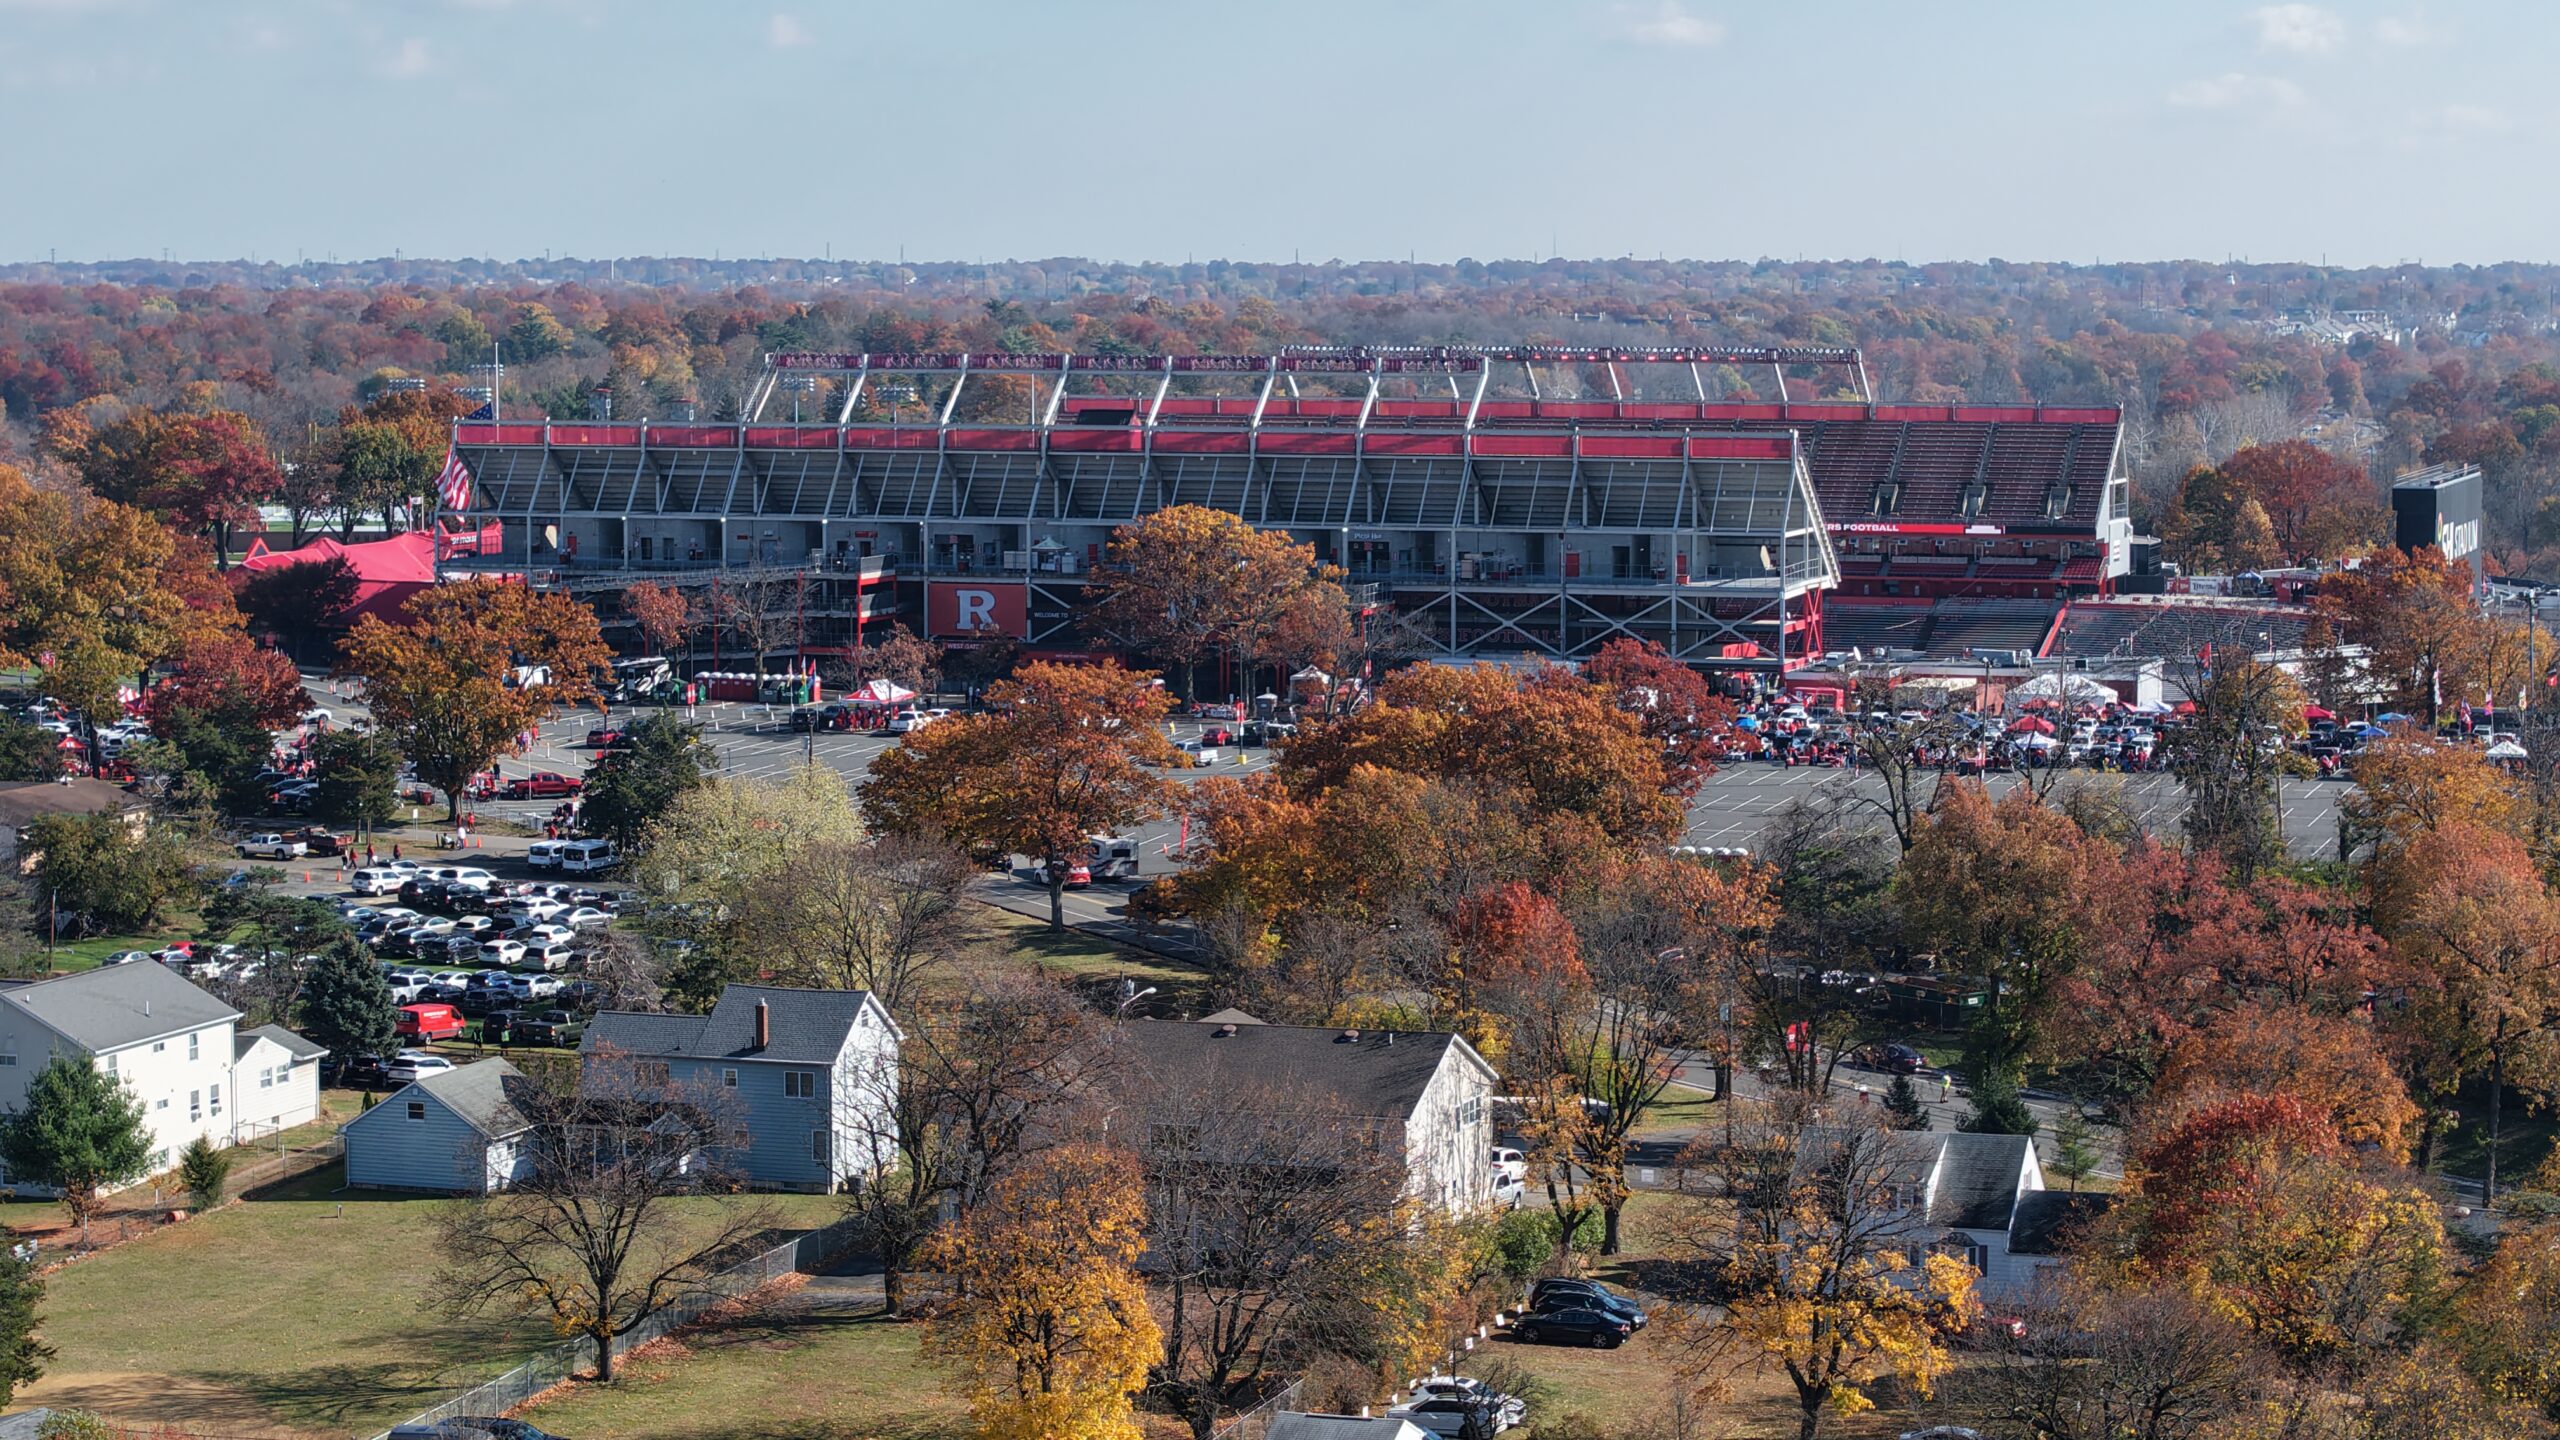
We’re pretty confident this is the largest database of Rutgers football weather on the internet, and maybe in real life, too. Here’s what’s inside:
Away and bowl games are now added
You can now filter games by five types of conditions: Any, Clear, Rain, Snow and Indoors. Before, you would have to use our specific weather filters to find those conditions. This is done in one dropdown.
Download the data for yourself to view.
We’re looking to make one more round of upgrades during the season, too! That includes additional sorting features, putting this within the www.cupajoe.live website and, if we have time, adding hourly data too.
It’s thanks to our presenting sponsor, www.rutgersparking.com. Located just 500 yards away from SHI Stadium, it has everything you need for your game-day experience. Make sure to enter our 2026 Rutgers Redzone Giveaway for 2 tickets and parking here.
Louisiana’s coastline is facing a growing threat from rising seas, sinking land and disappearing wetlands, according to a Tulane University scientist who joined the latest episode of Tidal Flooding Talk.
Dr. Torbjörn Törnqvist, a geology professor at Tulane, said sea level is rising about three times faster along coastal Louisiana than the global average. One major reason is that the land itself is sinking—a process common in large river deltas but especially serious near the Mississippi River.
That combination has made Louisiana one of the world’s most vulnerable coastlines.
The region’s wetlands sit only slightly above sea level and help protect communities from storm surge. As the water rises, those marshes can drown and disappear. Törnqvist warned that continued wetland loss could eventually leave New Orleans increasingly exposed, almost like an island surrounded by the Gulf of Mexico.
However, he stressed that his research is not telling residents to pack up and leave today.
Törnqvist lives in New Orleans and said he hopes to remain there for the rest of his life. The larger concern is what conditions could look like for future generations and whether communities will begin preparing before the situation becomes more difficult.
The exact timeline remains uncertain. Major changes could take centuries, but serious problems may develop much sooner as wetlands disappear and the shoreline moves inland.
Louisiana residents also have deep connections to the coast. Fishing, oil and gas production, recreation and family history are tied to the region. That makes any discussion about moving or adapting deeply personal.
Törnqvist said there is no simple answer. Communities may need a mix of stronger protection, careful planning and greater flexibility over time. The goal is not to create panic, but to avoid a future in which families are forced to make major decisions during a crisis.
The episode makes one point clear: Louisiana’s coastal threat is already measurable. The harder question is how residents and leaders will respond while there is still time to plan.
Note: The time of the partial eclipse in the video is supposed to be 10:33 p.m., not 9:33 p.m. Our apologies.
New Jerseyans who stay up late Thursday night could see the Moon turn a dramatic reddish-orange — if the clouds cooperate.
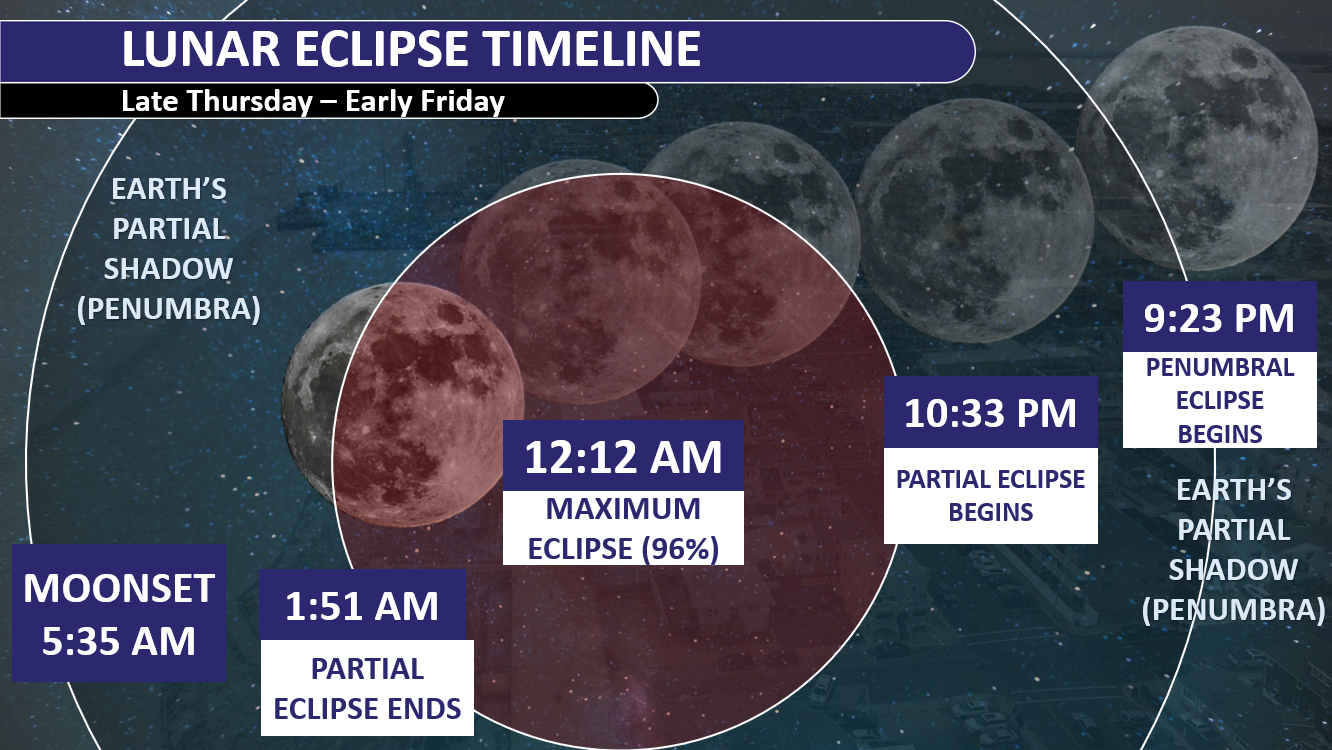
A deep partial lunar eclipse will take place Thursday night into early Friday morning, with 96.2% of the Moon’s visible surface covered by the darkest part of Earth’s shadow at its peak. That puts this eclipse exceptionally close to becoming a total lunar eclipse.
The eclipse begins subtly at 9:23 p.m. Thursday, when the Moon enters Earth’s penumbra, or faint outer shadow. At first, the difference may be difficult to notice.
The show becomes much more obvious beginning around 10:33 p.m., when the Moon starts moving into Earth’s umbra, its darker central shadow. From there, an increasingly large portion of the Moon will darken and take on shades of red, orange or copper.
Maximum eclipse arrives at approximately 12:12 a.m. Friday, when roughly 96% of the lunar disk will be immersed in the umbra. Only a thin portion of the Moon will remain brightly illuminated.
The reddish color happens because sunlight passing through Earth’s atmosphere is filtered before reaching the Moon. Blue and violet wavelengths scatter more readily, while more red and orange light makes it through the atmosphere and reaches the lunar surface.
The Moon will then gradually move out of the shadow. The partial eclipse ends around 1:51 a.m., while the final, much more subtle penumbral phase continues until about 3:01 a.m.
Will NJ actually see the lunar eclipse?
That’s the bigger question.
Unfortunately, the weather may not cooperate. A warm front moving through the region Thursday is bringing widespread showers and thunderstorms, along with plenty of cloud cover. The National Weather Service in Mount Holly says the warm front will be followed closely by a cold front Friday, keeping the region unsettled.
That means many parts of New Jersey could have clouds blocking the Moon during at least portions of the eclipse. However, any breaks in the clouds around midnight could provide a window to see the eclipse near its peak.
Unlike a solar eclipse, no special eclipse glasses are needed to safely look at a lunar eclipse.
And if the clouds win Thursday night, New Jersey will get another shot at an even bigger event in a few years: the next total lunar eclipse visible from the Garden State is June 26, 2029.
August 21, 2025 brought the single-worst summertime tide on record for most of Atlantic and Cape May counties.
Beaches closed. Water rescues on the White and Black Horse Pikes. Feet of water on the roads.
https://www.facebook.com/reel/4139828906290428
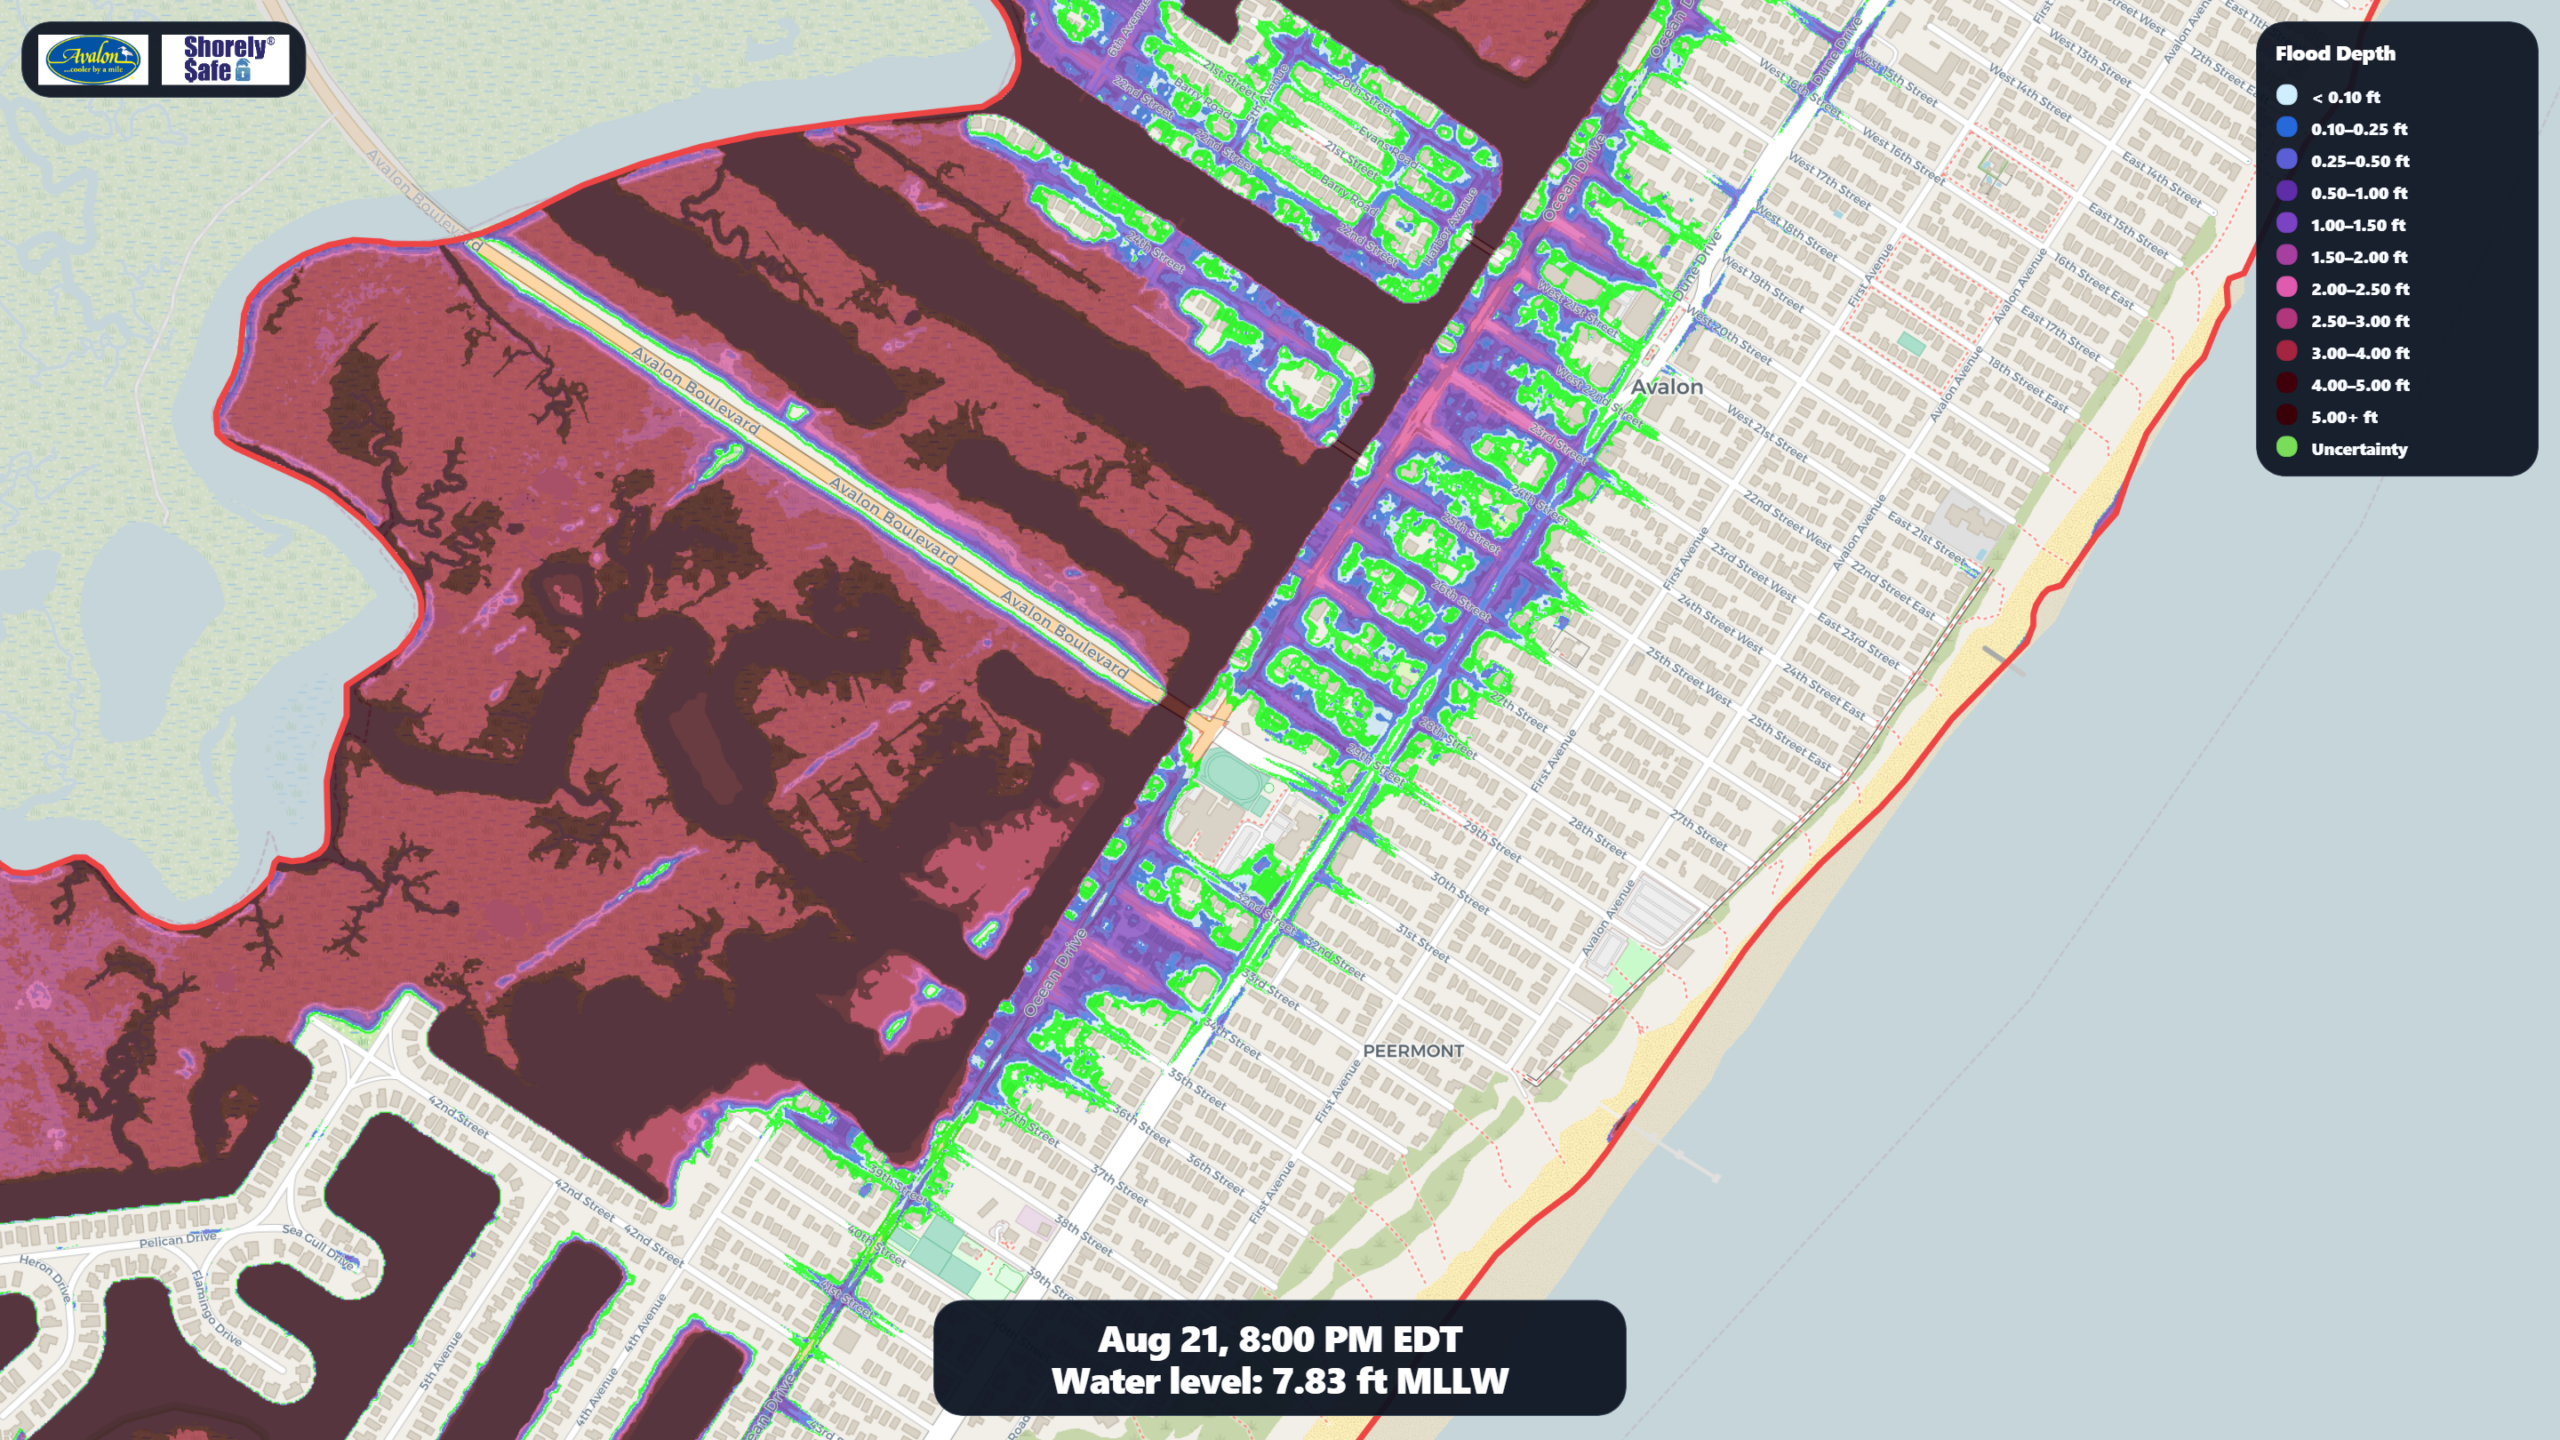
That sparked me to create our ShorelySafe Flood Mapper.
For so long, the coast NEVER had a way to show where weather-driven tidal flooding would be. The flood mappers out there were either for landfalling hurricanes or trends decades away. Preparing for tidal flooding coming tomorrow has traditionally relied on local knowledge and *county*-specific forecasts.
I knew we could do better when Hurricane Erin passed 400 miles offshore. What about town level? Block level? House level? If you knew when and how high the salt water would be:
– There would be fewer water rescues.
– Cars and property would be protected better.
– Emergency Management would save time, and money.
So, we got to it. PJ Hondros joined ShorelySafe to help build it. He’s a young legend in the coastal processes space. After 3 months, we had a prototype and we’re fully functional now.
Here’s what ShorelySafe would have shown during Hurricane Erin last August in our ShorelySafe communities — street by street.
A series of hard freezes hit farms and bogs hard in New Jersey and beyond during late April, causing an estimated $300 million in crop losses, with crop damage exceeding 30% in many parts of the state.
On May 20, Gov. Mikie Sherrill declared a state of emergency for all 21 counties in the state. She also sent a letter to U.S. Secretary of Agriculture Brooke Rollins to unlock federal funding relief for New Jersey farms.
“This freeze was unlike anything our growers have experienced in decades, and the damage is staggering,” said Sen. Cory Booker. “An entire season of peaches, apples and grapes were almost entirely decimated in a matter of hours. Many other fruits are also suffering significant losses. New Jersey farmers urgently need federal support to recover from this disaster.”
Maybe you know of a farmer who had losses. After all, there were over 600 farms between Cape May and Atlantic counties in 2022, according to the U.S. Department of Agriculture. That’s over 38,000 acres responsible for $167 million in products sold. Tourism, agriculture and fishing are the top three economic engines at the South Jersey shore. All are dependent on weather.
Freezes in late April are common for inland New Jersey. The average last freeze of spring at Hammonton is April 18, according to the National Oceanic and Atmospheric Administration. Atlantic City International Airport’s is April 19. In the deeper Pinelands, the last freeze on average is near the end of the month.
But what happened on April 21 was not normal for two reasons and may be more of a sign of things to come. First is just the sheer cold of that morning. Not only were inland low temperatures for the coastal counties below freezing, but they were at or below 28 degrees in spots. That’s considered a hard freeze which destroys most seasonal vegetation, especially the young, tender crops that were just starting to grow.
“Suffice it to say that this is one of the most widespread disasters on record to strike almost every fruit-growing tree, bush, or vine in the state. The horticultural industry also appears to have taken a notable hit,” said Dave Robinson, the New Jersey state climatologist, in his monthly report for April.
It wasn’t just the cold temperatures that made the agricultural loss devastating, prompting the state of emergency. It was the weather that led up to it.
It was warm. Really, it was hot. Temperatures sizzled between 85 and 95 degrees between April 14 and April 17, according to NOAA. Overnight lows stayed in the 50s and 60s.
That kind of warmth drove crops and plants to open and grow faster than usual for that time of the year.
When the freeze came on April 21, the plants were left exposed and many were killed. This will surely be a top 10 weather event for the year.
The executive order issued by Gov. Sherrill provides for increased coordination between state agencies to help farmers with what they may need. State Police Superintendent Jeanne Hengemuhle will lead the effort.
Federal crop insurance which, like the National Flood Insurance Program many of us are aware of at the shore, is backed by the Federal Government to protect against losses that many private insurers won’t take on. The problem is it has a cap of $325,000. For large farms, that’s just a percentage of what they could have lost.
While frosts and freezes during the growing season are fairly common, most are minor issues for farmers. The last significant one was in 2012. That year, a hard freeze hit on April 28, about a dozen days after a stretch of warm weather with lows in the 50s and highs in the 80s.
This year’s killing freeze arrived much sooner after the warm weather ended than it did in 2012 – and it was also a bit colder.
In our climate-changing world, sharp, hard freezes after days of plant-growing heat are expected.
The date of the last freeze of the year hasn’t changed much over the decades. In fact, at Atlantic City International Airport, the average last freeze is three days later now (April 18) than the average was in the 1970s (April 15-16). In Hammonton, it’s been roughly the same – around April 15.
However, hot days are occurring earlier. Three days or longer of high temperatures of at least 80 degrees in April has about a 20% chance of occurrence in the 2020s. In the 1970s, it was about 5%. The result is more growth in our fruits, vegetables and crops before a killing freeze.
The last freeze is barely changing because the ingredients for a cold spring night aren’t as influenced by a changing climate. It requires a clear sky, light wind and low dew points.
Meanwhile, warmer spring days are driven by the greenhouse effect. The more greenhouse gases in the air, the more solar radiation from the sun is trapped near the surface, where we live.
Finally, not to rub salt in the wound with this article, but I gave Memorial Day Weekend a “D” in the Shore Summer Weekend Weather Report Card. The first weekend of our eighth edition earned the barely passing grade, mainly because of Monday. Temperatures finally got out of the 50s at the beach and it wasn’t an all-day washout. Better luck this weekend.
We live by the sea breeze and die by the sea breeze.
Figurately, of course, but only kind of. How often has it been 95 degrees in Hammonton or Trenton, only to fall to 78 degrees in Ocean City or Atlantic City? That kind of change would make you feel alive if you made that trek to the beach.
Alternatively, take May 4, 2026. It was 72 in Hammonton and Trenton. Atlantic City was 58 degrees. I have a feeling that took the life out of some outdoor plans.
Even if you’re at the beach all day, how many times has it felt hot in the late morning? Then, you cool off with a refreshing breeze for the afternoon.
Sea-breezes are a near daily occurrence of our lives for the Jersey Shore from roughly March to August. May is typically home to the strongest sea breezes and strongest differences between inland and coastal areas.
The sea breeze makes the Jersey Shore the $20 billion economic engine it is according to the New Jersey Department of Tourism (2023). Doctors would prescribe patients time at the water’s edge to take in the cleaner air coming in from the ocean. Before air conditioning, the Camden and Atlantic Railroad, the West Jersey Railroad, Tuckerton Railroad and more opened the dream of refreshing summer air to the masses. Even today, the thought of a beach chair on the sand with the warm sun and cool breeze in your face is a pleasant sight.
Why do sea breezes happen?
In short, the sea-breeze is Planet Earth’s way to bring equilibrium to the atmosphere. The Earth is always trying to stay balanced against the constant change in the Earth’s tilt, orbit around the sun and more.
In more detail, the sea breeze is caused by the sun warming up the land much faster than the body of water. It takes roughly 4.2 times more energy to heat up water a degree versus heating up land. Mainly, it’s because water, a liquid, can mix around, shifting its temperature around, faster than a patch of beach or forest can. The scientific phrase for this is heat capacity.
Warmer air also brings lower air pressure. Cooler air brings higher air pressure. Winds always move from high pressure to low pressure. Due to physics, cooler air up to about 3,000 feet high will actually move onto land. That warmer air rises into the atmosphere. The line between the land breeze and sea breeze can create clouds. If there’s a lot of upward motion, it’ll even create rain showers.
The red line in the spine of New Jersey are birds, insects and bugs being pushes east to west by the sea-breeze front (via the Office of the NJ State Climatologist)
Sea breezes are localized features we call mesoscale features. It’s different than the widescale, synoptic winds that blow. If winds are blowing out of the northeast, off the water, due to a nor’easter, that is not a sea breeze. That’s just the way the wind’s blowing.
Sea breezes typically blow at 10 to 20 mph.
Mini cold fronts
The cooling sea breezes we see in New Jersey are actually mini cold fronts moving in from the east. Typically, most cold fronts we think of in New Jersey come from the west or north. The drier, typically cooler air that follows the cold front are west or north winds. That is blowing in air from the larger area of high pressure in, say, Canada, replacing the lower pressure air.
In New Jersey, the sea breeze cold fronts are stronger than other areas of the United States. That’s because of the Pine Barrens. The sandy soil of the Pinelands means the land heats up faster than other landmasses. It’s common for Egg Harbor City or Batsto to be the hottest place in the state. That creates a bigger air pressure gradient, which creates a stronger sea breeze.
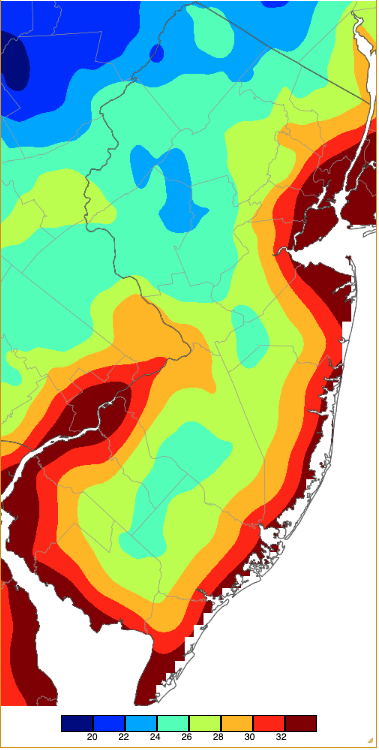
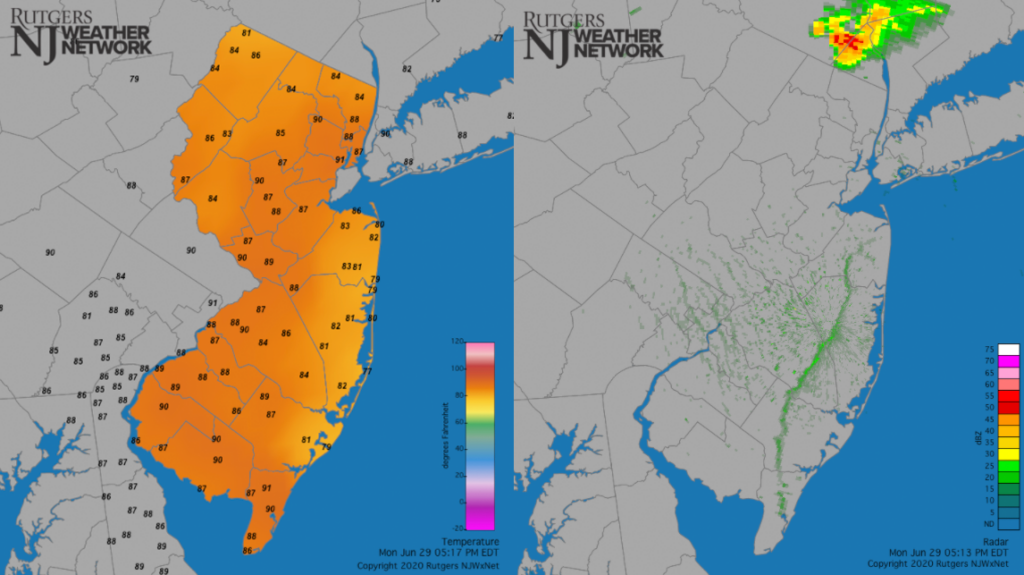
A typical sea breeze look at temperatures (left) and radar. Note that Cape May County’s beaches are also in the 70s but there are no weather stations on the beach at this time.
How to spot a sea breeze in NJ
Keep in mind that northeast, east or southeast winds that blow for days at a time are not the sea breezes we’re talking about here.
To have a real sea breeze, winds need to start out from an offshore direction and then shift onshore as the day goes on.
First, you’ll need the sun to heat the ground for a few hours. A cloudy sky can bring a sea breeze during the late spring and summer, too, thanks to how strong the sun is.
The strength of the wind matters, too.
If winds are constantly blowing under about 15 mph, there’s a good chance the sea breeze will form during the late morning or midday if the large-scale winds are from offshore at first.
As an example, if 10 mph from the southwest start off the morning, you’ll get a sea breeze to develop by noon.
If winds are over about 15 mph, whether you see a sea breeze depends on the direction that large-scale wind is blowing.
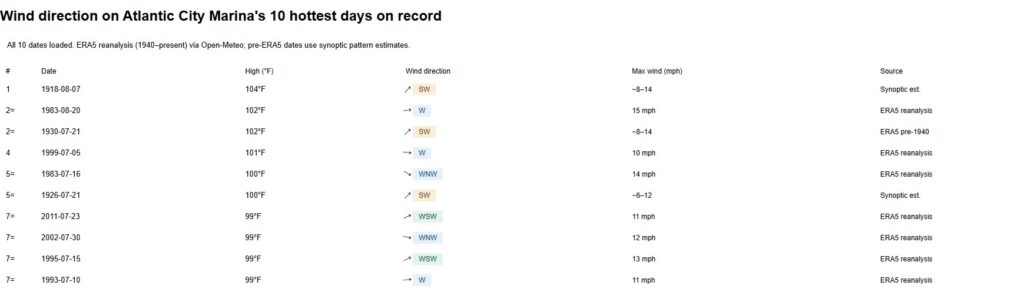
Winds from the west or northwest will be too strong for the sea breeze to develop. They directly push back against it. These are the days that are the hottest on sand and inland. In fact, seven of the top 10 hottest days at Sen. Frank S. Farley State Marina in Atlantic City had a wind out of the westerly or northwesterly direction, according to Open-Meteo and ERA5 data.
Claude.ai helped with this analysis of Atlantic City’s hottest days on record, and their wind direction.
Sadly, it’s also the days when the bugs swarm the shore all day long.
However, winds from the southwest or north at those higher speeds don’t directly push against the developing sea breeze. Typically, they’ll still form.
The Delaware Bayshore also gets cooling sea breezes, but they’re not as noticeable since the bay temperature is more in line with the land temperatures nearby. There isn’t as much as an air pressure gradient that creates that cooling wind.
Still, for Cumberland and Salem counties, any wind that isn’t pushing directly against the coastline or with it can cause a sea breeze.
For Cape May County’s Bayshore, a south or north wind can still develop those localized sea breezes.