Category: Uncategorized

  • With polar vortex unlocked, NJ likely gets a frigid start to winter

    With polar vortex unlocked, NJ likely gets a frigid start to winter


    Stream the Jersey Shore Live Weather Channel for free!

    The polar vortex has been poked and distributed in the stratosphere. Now it’s a waiting game as rounds of Arctic air run through New Jersey, reload and sweep through the Northeast again for much of December.

    As of Nov. 30, the time of this writing, it was unknown whether the Sudden Stratospheric Warming (SSW) occurred near the North Pole. If the stratospheric polar vortex were disturbed so much that its westerly winds reversed course, causing the SSW, and it happened in November, it would be the earliest in the satellite era (1968).

    Either way, though, the polar vortex’s spinning top at the North Pole was disrupted. Much warmer-than-usual air filled into the Arctic about 100,000 feet high. The stratospheric polar vortex stretched south into North America. Specifically, it moved into Western Canada and Alaska.

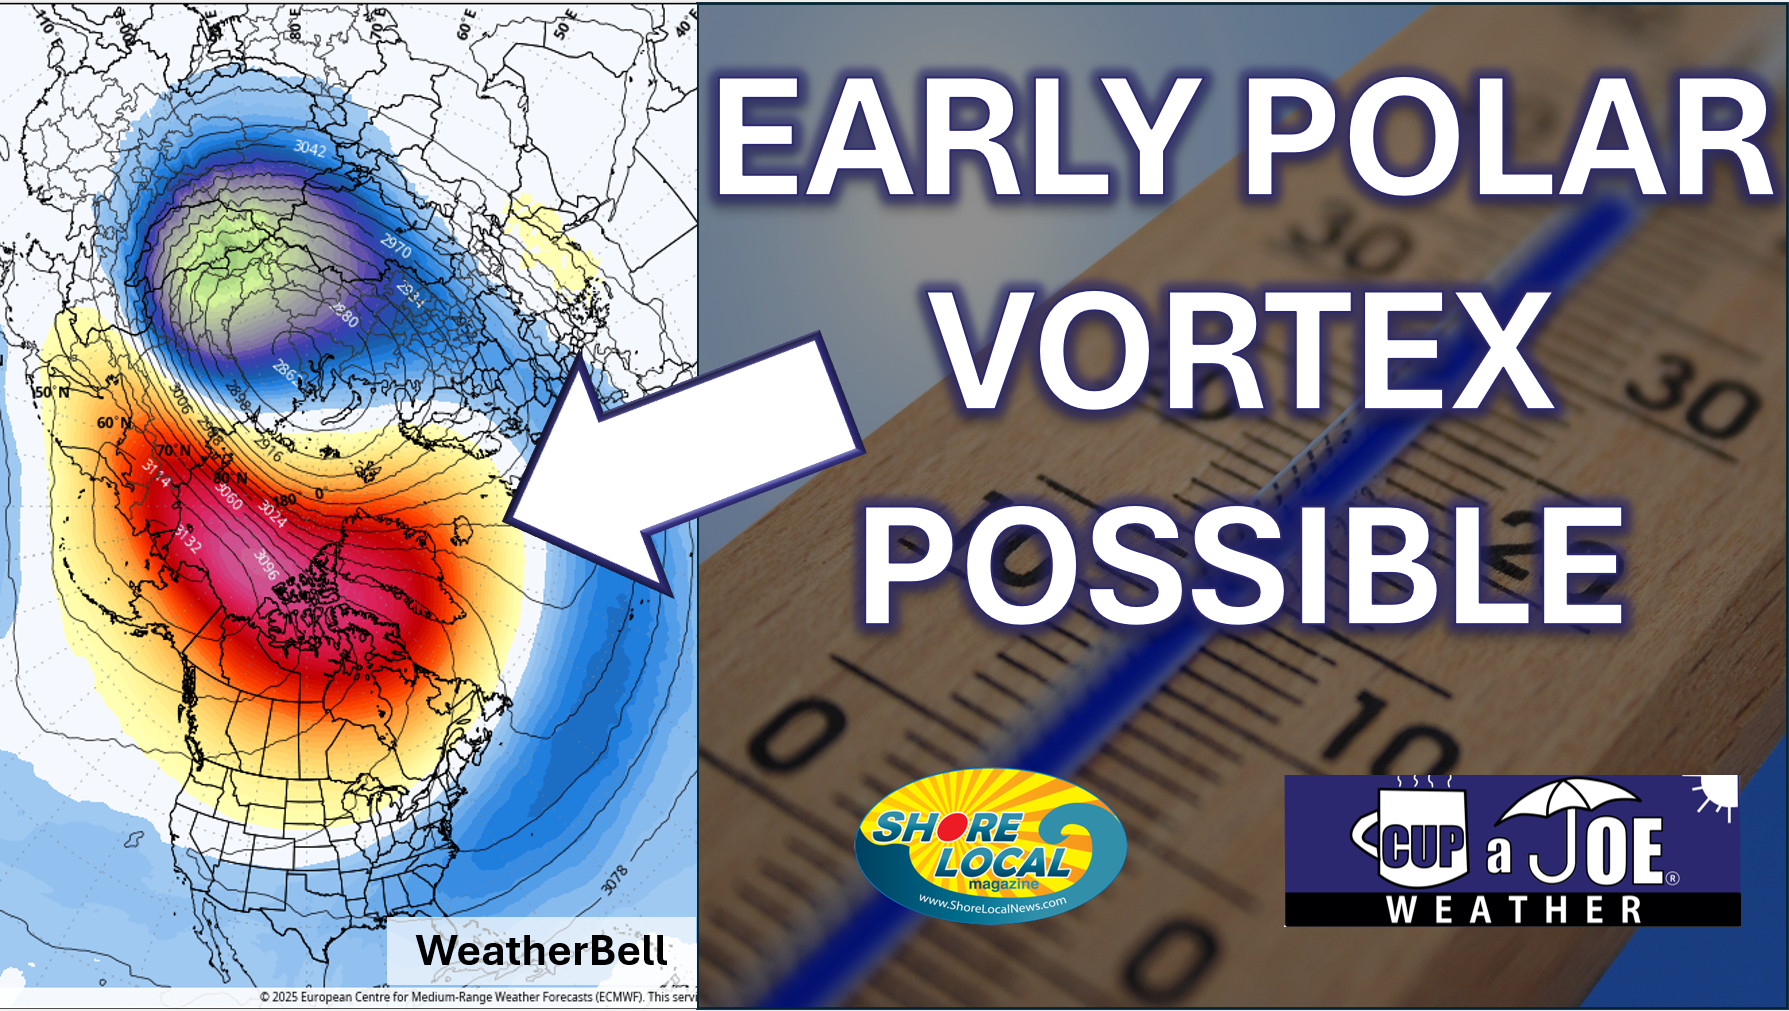
    The height above sea level where you reach 10 millibars of pressure (lines) with its departure from average in blue, yellow or red for Nov. 30. Notice the red area in Western Canada and Alaska. That’s where the center of the polar vortex was (via WeatherBell).

    The extremely cold air in the stratospheric vortex almost never mixes directly down to the surface. Instead, the SSW changes the large-scale circulation, which then allows pre-existing surface-level Arctic air (from northern Canada, Siberia, etc.) to plunge southward in the troposphere.

    As of Nov. 30, that Arctic air had surged south from the North Pole to Hudson Bay and Quebec, Canada, according to Ryan Maue, a meteorologist and climate scientist at WeatherTrader.

    The jet stream, the river of air about 30,000 feet high, which separates polar and tropical air masses, then becomes wavy, moving south to north, to south again. The jet stream is in the troposphere.

    That clash of warm and cold air from the jet stream also causes cold-core storms, like a nor’easter to form at the surface. For now, though, let’s focus on the cold.

    When will cold air outbreaks occur at the Jersey Shore?

    There are three times for colder-than-average temperatures:

    1. A continuation of the current cold through Dec. 6

    2. Dec. 8-10

    3. Dec. 14-18

    These aren’t long stretches of cold, however, it will be 10 or more degrees below average for many of those days. That translates to high temperatures in the upper 30s to low 40s. For low temperatures, this means lows on either side of 20 degrees inland. Meanwhile, the shore would see lows of 25 to 30 degrees.

    Remember that our coldest day of the year, on average, occurs in the second half of January. So, while they don’t sound extremely bitter for late January standards, this is not what it should feel like in early December.

    The National Oceanic and Atmospheric Administration (NOAA), forecasts Dec. 7-13 to be below average for the Northeast and Great Lakes states. However, NOAA has the most confidence on below-average temperatures for every county in New Jersey except for Cape May County – a sign that the Cape May Bubble is still strong year-round.

    All kidding aside, it will be a chilly start to climatological winter, which runs from Dec. 1 to Feb. 28, the coldest three months of the year, on average.

    Forecasting what days snow will fall at the Jersey Shore more than five days out is nearly impossible. I won’t do that. However, there are two forces at play. How much snow we see, or don’t see in December will prove which force was stronger.

    A colder-than-average December is simply better for snow than a warmer-than-average December. It gives you more opportunity for snow. It’s that simple.

    On the other hand, a pattern appeared in November. When it’s dry, it’s colder than average. When there is precipitation, it’s at or warmer than average. That cold and dry, or mild and wet pattern drives snow lovers crazy. It’s a function of the storm track being at or west of New Jersey. That brings more southerly, warmer winds around counterclockwise-spinning storms.

    At the Sen. Frank S. Farley State Marina in Atlantic City, 10 days also had precipitation in November. Eight of them were above average or within a degree of average, according to NOAA. Ten days of precipitation also happened at Atlantic City International Airport; six of them were above average or within a degree of average.

    To see how the polar vortex could interact for yourself, go to a weather forecast model website like WeatherBell (subscription needed) and look at the 2PVU (potential vorticity units) forecast, which looks at the boundary between the troposphere and the stratosphere.

    Where you see the blues and purples indicates the outline of the polar vortex boundary. In a strong polar vortex, it is compact, circular and centered near the Arctic. If it’s not, like the first half of December, that means the polar vortex has weakened, which eventually allows frigid air at the ground to spill places south.

    Joe Martucci, a Certified Broadcast Meteorologist and Digital Meteorologist, is the President and Director of Meteorology for Cup A Joe Weather and Drone. You can connect with him at cupajoe.live/.

  • Record setting phenomenon threatens cold, polar vortex in NJ this December

    Record setting phenomenon threatens cold, polar vortex in NJ this December

    Blasts of frigid for December air may be NJ’s reality this December thanks to an unusual chain of events bringing the polar vortex.

    Meteorologists like me are keeping a close eye on the sky above the North Pole. We’re watching for something called a sudden stratospheric warming (SSW). If an SSW happens, it’s like poking a big, spinning cold-air circulation called the polar vortex.

    When you poke it, the vortex can wobble and send frigid air south. That cold air could slide all the way down to New Jersey in the middle of December. If it does, we would get temperatures that are way colder than normal.

    “If a full SSW is achieved in November, as predicted by the ECMWF (European Centre for Medium-Range Weather Forecasts), that would be the first time in the satellite era (post 1979),” said MIT climatologist Judah Cohen in his blog Nov. 18. (Dr. Cohen was also our guest on Tidal Flooding Talk on Nov. 25)

    If this occurs, that means December will be more like “Decembrrr,” with it “beginning to look a lot like Christmas,” as the Perry Como song goes.

    What is sudden stratospheric warming?

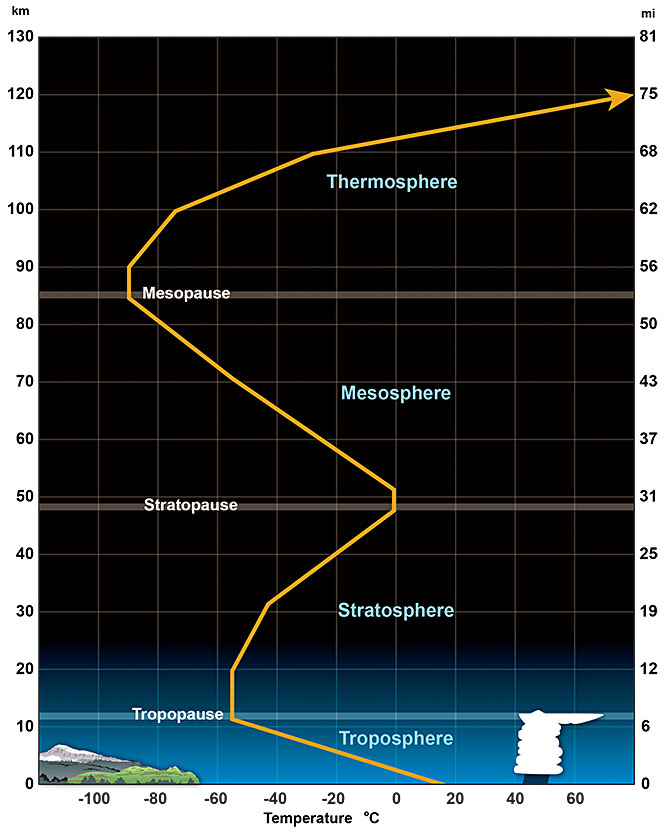
    Sudden stratospheric warming is a process in which the temperature of the stratosphere, the second lowest layer of Earth’s atmosphere, warms quickly. Typically, this is about 30 to 50 degrees within a week.

    The layers of the atmosphere on Earth (Via NOAA)

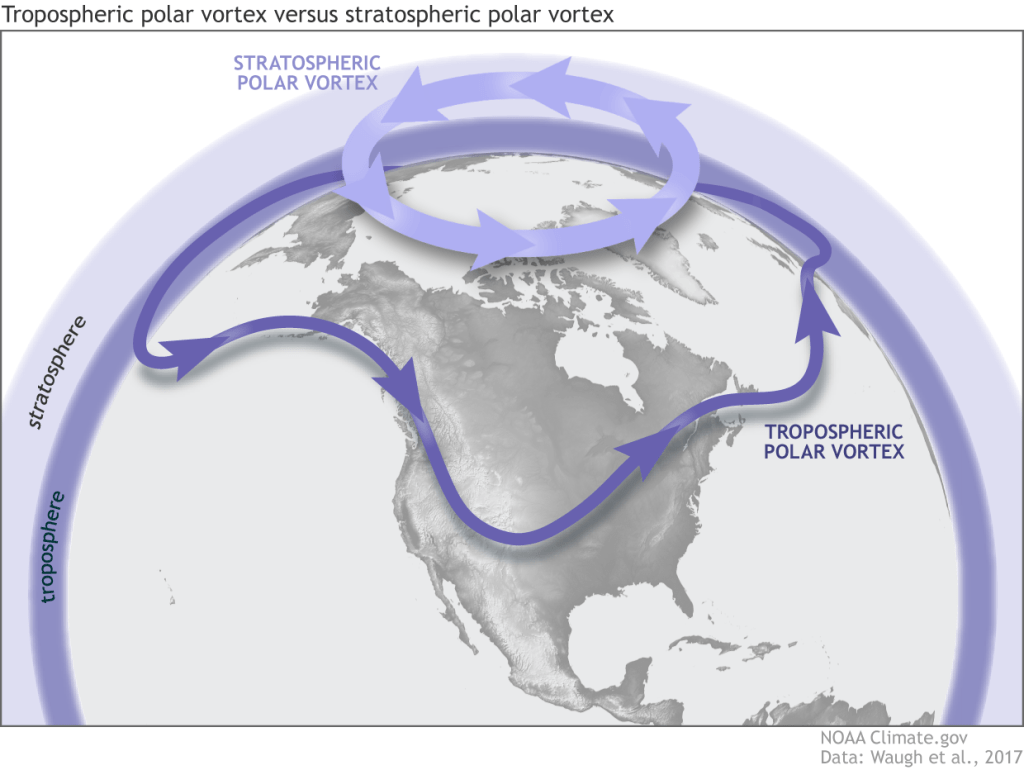
    When this occurs, the polar vortex — the spinning area of very cold, westerly winds in the stratosphere that typically sits over the North Pole — is disrupted. When that happens, it can do one of the following:

    1. Split into two or more pieces, pushing south from the North Pole.
    2. Winds weaken dramatically or even reverse and come out of the east.
    3. Stretch itself farther south.
    When you hear that the polar vortex is disrupted, that means the stratospheric polar vortex. The stratospheric polar vortex likes to spin counterclockwise at the North Pole in the Northern Hemisphere. However, can be disturbed by a SSW event (Via NOAA).

    Note that SSWs can only occur during roughly October to April, when the polar vortex is strong. Outside of this time, the polar vortex is weak and essentially hibernates for the warm season.

    What does polar vortex disruption mean?

    When the polar vortex is disrupted — in this case by sudden stratospheric warming — the stratospheric vortex can shift over parts of the Northern Hemisphere, usually between 40 and 65 degrees north latitude. The Jersey Shore sits between 38.9 and 40.5 degrees north latitude.

    The extremely cold air in the stratospheric vortex almost never mixes directly down to the surface. Instead, the SSW changes the large-scale circulation, which then allows pre-existing surface-level Arctic air (from northern Canada, Siberia, etc.) to plunge southward in the troposphere.

    The jet stream – the river of air about 30,000 feet high which separates polar and tropical air masses – becomes wavy, moving south to north to south again. The jet stream is in the troposphere.

    That clash of warm and cold air from the jet stream also causes cold-core storms, like a nor’easter, to form at the surface. Put that on the East Coast and position the cold air from the jet stream exactly right, and New Jersey has a snowstorm.

    However, not all polar vortex disruptions impact New Jersey, or even the East Coast. The frigid cold can spill into the Great Plains, like it did in February 2021 when much of Texas was without power. It can go to Europe, or Asia, too.

    How often do sudden stratospheric warming events occur?

    SSWs have about a 50% chance of happening in any given winter. The Washington Post says it happens once every other winter, on average.

    When they do happen, they’re typically in January or February. As MIT’s Cohen said, never in the satellite era has an SSW event happened in November. November SSWs were observed in 1958 and 1968, but in an era before high-tech weather satellites, high-altitude airplane observations and more, this isn’t a reliable claim.

    The most recent SSW event in the Northern Hemisphere was in early March of this year. It quickly brought the end of the polar vortex season. In fact, it was the second earliest SSW to end the cool season since 1958.

    However, it didn’t mean much for New Jersey. March was well above average up and down the state. The polar vortex, and its impacts, went to Europe instead.

    What do early sudden stratospheric warmings mean for N.J.’s winter?

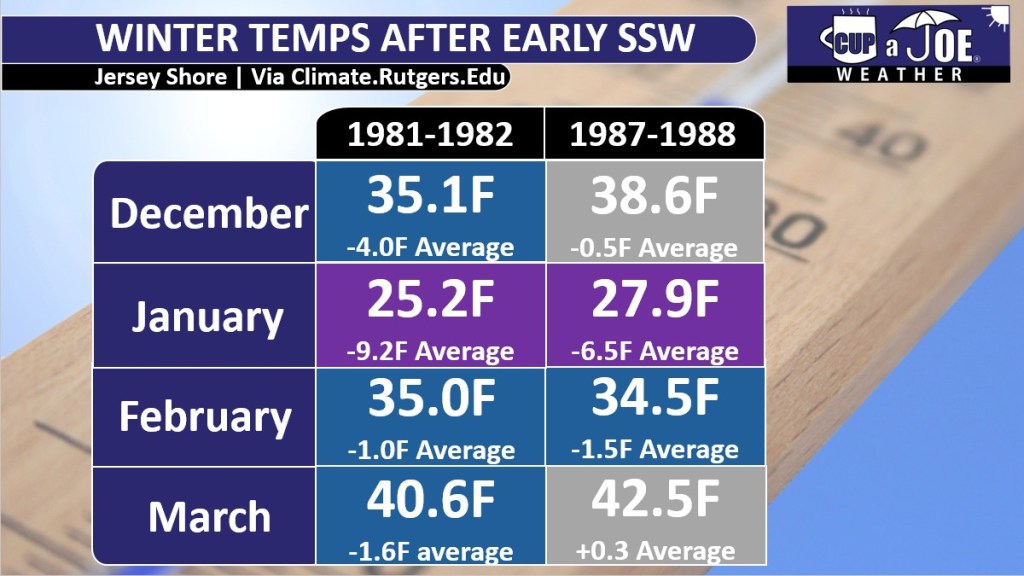
    Two winters had SSWs in early December: 1981-1982, and 1987-1988, according to Cohen.

    Both of those followed the same pattern when it came to temperatures. January was at least 6.5 degrees colder than the current average. January 1982 was the sixth coldest January on record for the Jersey Shore going back to 1895, according to the Office of the New Jersey State Climatologist.

    February was also below average, but less so, between 1 and 2 degrees.

    December and March had differences, too. In 1981-1982, both months were colder than average. December was a whole 4 degrees below average.

    The winter a few years later saw above average temperatures for December and March.

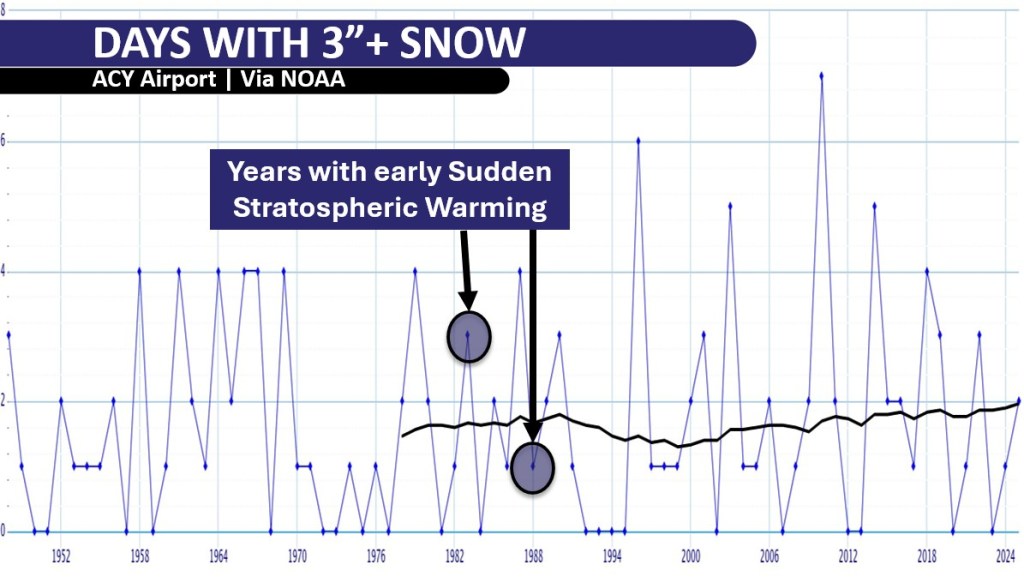
    All that cold doesn’t translate to snow, though. Both the winters of 1981-1982 and 1987-1988 saw two days with more than 3 inches of snow at Atlantic City International Airport, according to the National Oceanic and Atmospheric Administration. That’s about average.

    Other parts of the shore had the same fate. In Lower Township, Cape May County, 3 or more inches of snow occurred on just one day in winter 1981-1982. The 1987-1988 winter had two days.

    Long Branch, Monmouth County, only had data for the winter of 1981-1982. However, even there, 3 or more inches of snow occurred twice, which is below average. Big cold doesn’t always translate to big snow.

    What can we expect this december?

    Like my winter outlook story said, we need to watch for an early start to the cold and perhaps snow in the first few weeks of December. First, we have to wait and see if that sudden stratospheric warming (SSW) happens this week up in the Arctic.

    If it does happen, follow me online for updates. I’ll watch where that super-cold Arctic air will rush down to the ground. We will know by the first few days of December if that cold air is heading for New Jersey or not.

    If it does come to New Jersey, it would mean an extended period, or maybe a few prolonged periods, between Dec. 10 and Dec. 31, when it is much colder than average. We are talking daytime highs only in the 30s. At night along the shore it would drop to the 20s, and inland it would get down to the teens when clear.

    We are still weeks away from the coldest part of winter, so those numbers are pretty cold for December.

    It is still too early to make a clear snow forecast. However, temperatures in the 30s are much better for snow than temperatures in the 50s. So if we get that cold air, I expect at least some snow that sticks to the ground.

    Stay tuned for more updates, and Happy Thanksgiving to you, your friends and your family. Enjoy the free $400 ShopRite turkey.

    Joe Martucci, a Certified Broadcast Meteorologist and Digital Meteorologist, is the President and Director of Meteorology for Cup A Joe Weather and Drone. You can connect with him at cupajoe.live/.
  • Historic 1st Snows at Jersey Shore: Facts and Figures

    Historic 1st Snows at Jersey Shore: Facts and Figures

    The first snow of the season at the Jersey Shore is usually something to smile about. It’s light and fun. Maybe just a few flakes in the air or a quick snow shower that melts fast. It makes you think of cozy things: a warm fire, snow on the sand at the beach, or a surprise day off from school or work.

    At two weather stations near the Jersey Shore – Atlantic City International Airport and Lower Township – the first snow average is 1.6 inches deep. That’s not much. Most people think it’s more fun than trouble.

    However, sometimes the first snow is a big surprise.

    Four times at Atlantic City International, and three times in Lower Township, the very first snowy day of the season dropped more than 6 inches. That’s a lot for the first one.

    I love snow any time, but a huge first snow can catch everyone off guard. It’s like playing a big game without warming up, or running a race in brand-new shoes. Nobody is ready yet. Meteorologists might miss a forecasting tidbit. Road crews might not put out enough salt and plows. Drivers forget to go slow and careful like they do later in winter. That makes slippery roads extra dangerous.

    On average the first real snow at the Jersey Shore waits until the second half of December. However, there are a few times in weather history when snow has been noteworthy and early.

    December 5, 2002

    In 2002 the first snow of the season at the Jersey Shore was a nor’easter that dropped more than 6 inches of snow.

    Every county in New Jersey had snow, according to NOAA. An area of low pressure developed on a frontal boundary along the Gulf Coast states. Eventually, that low pressure moved through the Southeastern United States, went off the North Carolina coast and quickly raced northeast, according to Raymond C. Martin Jr. It was a nor’easter.

    Snowfall totals were sizeable:

    • 7.6 inches in Estell Manor, Atlantic County
    • 7.0 inches in Hammonton, Atlantic County
    • 6.0 inches in Woodbine, Cape May County
    • 5.5 inches in Green Creek, Cape May County
    • 5.0 inches at Atlantic City International Airport

    Perhaps more impressive was that these totals were greater than the snow seen the entire previous winter in much of South Jersey. This was in the middle of a long stretch of colder-than-average temperatures. The snow that fell took six days to fully melt across the area as high temperatures stayed below 35 degrees nearly every day from Dec. 4 to Dec. 10.

    November 30, 1967

    Before 2002, you had to go back 35 years to experience a first winter storm as significant for the Jersey Shore.

    At ACY Airport 7.8 inches of snow fell, the second largest leading snowfall of the season on record (a late start in 2022 was higher). Lower Township experienced 3.0 inches of snow.

    This snow engulfed much of the Mid-Atlantic. A Baltimore Sun headline proclaimed: “Near Record November Snowfall Catches City Without Its Plows.”

    November 6, 1953

    This is one of the largest first snows on record, and one of the earliest, too. Snow spread from western North Carolina to New England.

    This wasn’t a 100% snowstorm; 3.2 inches of snow at ACY Airport mixed with a total of 3.98 inches of precipitation. In essence, about 10% of the precipitation that fell was snow. Still, it counts.

    Places farther south saw less snow mixed in. By the time you went to Lower Township, the storm was all rain. The Cape May Bubble was still alive and well then, too.

    The New York Times wrote that New York’s highways were covered in an icy sheen and many motorists going upstate had to sleep overnight in their cars.

    The storm was tropical at first. It was a tropical depression that moved across Florida. It then transitioned from a warm-core, tropical storm, into a cold-core, nor’easter. Ready for the storm was a huge mass of cold air in the Northeastern United States. That turned what was warm rain into some snow.

    December 8, 1928

    The third biggest first snow of the season in Lower Township’s long stretch of weather records (back to 1897), was a pure snowmaker, even at the immediate coast.

    Lower Township saw 9.6 inches of snow on 0.80 inches of precipitation, according to NOAA. That’s a snow ratio of 12:1, meaning this wasn’t a sloppy, wet mess of snow, either.

    ACY Airport wasn’t around yet. However, Atlantic City kept snow records then and they were blanketed in 3.9 inches of snow. High temperatures stayed in the 30s for the next two days after that, keeping the snow on the ground, too.

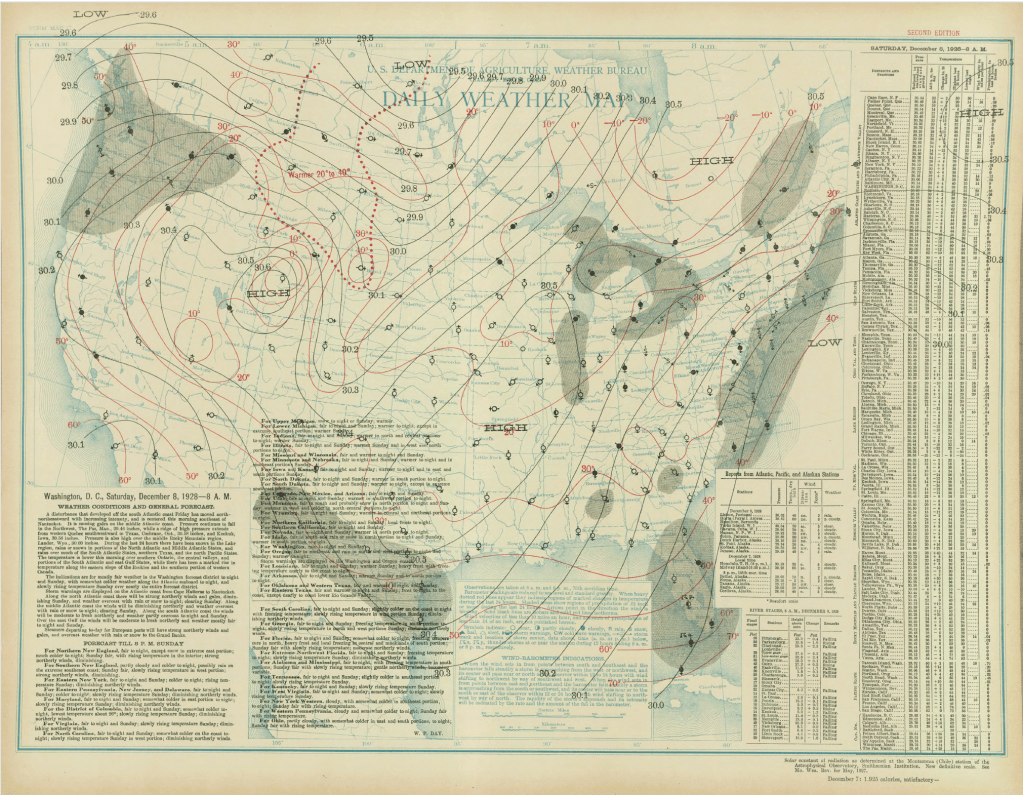
    Archive weather maps from NOAA show that this was a coastal storm. Low pressure the morning of Dec. 8 was roughly 40 degrees north latitude, and 75 degrees west longitude. Today, that’s known as the “benchmark,” or the position coastal storms should cross to bring at least some snow to the coast. Winds were from the north or northeast at the Jersey Shore, pumping in the icy air.

    The surface weather analysis for the Dec. 8, 1928 snow. The National Weather Service was a part of the United States Department of Agriculture then.

    Thanksgiving Day, 1912

    Talk about cold turkey. Nov. 28, 1912, brought a statewide blanket of snowfall, delivering a rare “White Thanksgiving.” In fact, it has an argument to claim a spot as the snowiest Thanksgiving on record statewide.

    In Lower Township, 4.5 inches fell. In Atlantic City, Northfield and Tuckerton, 4.0 inches fell.

    Barely an inch of snow fell in Taylor Ham land in the northern part of the state (yes, there’s a Central Jersey).

    I imagine there were a lot of melted (dirt) roads that turned into ice at night. The days following it were well above freezing during the day, dropping a good bit below freezing at night.

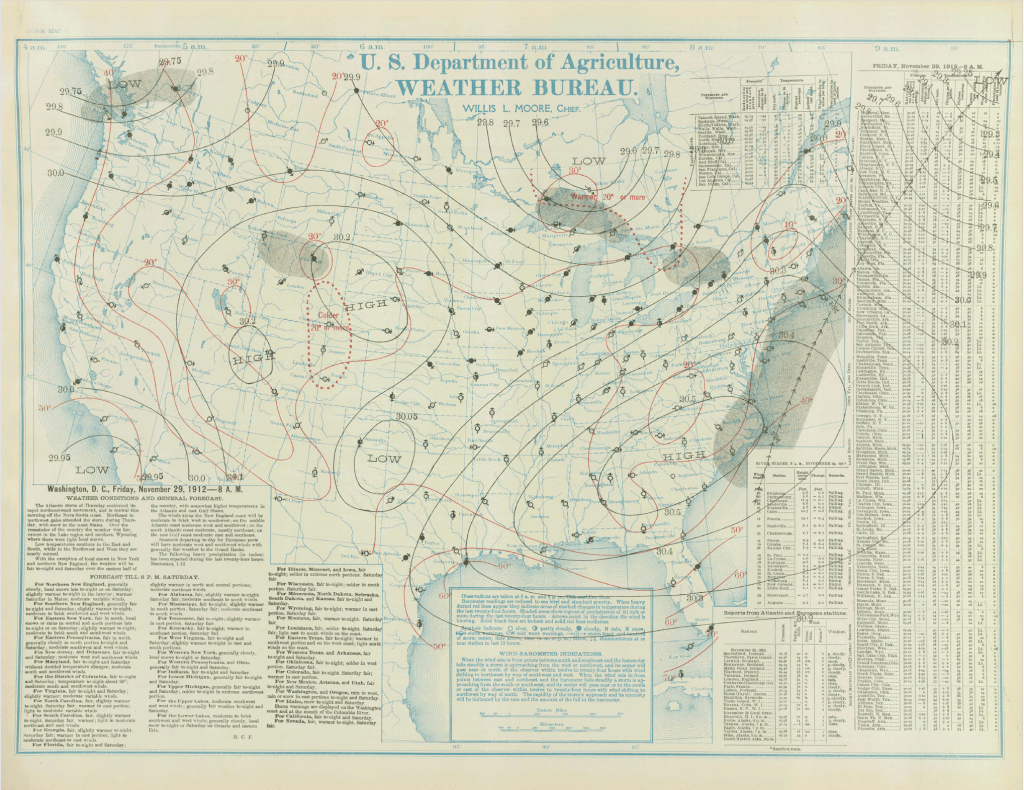
    Like the early 1928 snow, this storm was a coastal storm. Known as a Miller A type storm, it began off the Georgia coast. It quickly moved north-northeast, passing almost right at that 40-degree north latitude, 75 degree west longitude benchmark.

    The surface weather analysis for the Thanksgiving 1912 snow. The National Weather Service was a part of the United States Department of Agriculture then.

    What are your snow thoughts?

    Love it? Hate it? You want one snow and then that’s it? Drop me a note on social media or email.

    Joe Martucci, a certified broadcast meteorologist and digital meteorologist, is also the president and director of meteorology for Cup A Joe Weather and Drone. You can connect with him at cupajoe.live/.

  • A wild ride of temperatures: 2025-2026 Jersey Shore Winter Outlook

    A wild ride of temperatures: 2025-2026 Jersey Shore Winter Outlook

    The 2025-2026 winter outlook has similarities to last winter’s weather. However, there’s enough support in the forecast to give snow lovers hope this season. My Jersey Shore friends, it’s that time of the year again – time for the winter forecast.

    With the sun setting by 5 p.m., holiday decorations for sale at nearly every store and sweatshirt weather during the day, snow season is around the corner.

    Before we get into predictions, here’s a few important notes to remember:

    1. I don’t do my own winter forecasting. It takes a lot of time and research that begins in August and ends around Halloween. This forecast is a mix of some research I’ve done and information from trusted sources like Steve DiMartino of NY NJ PA Weather, a fellow certified digital meteorologist.

    2. Miles make a difference. In one storm, Ocean City could be all rain, while Egg Harbor Township has 3 inches of snow and Asbury Park has a foot. This forecast is for the general shore area, not one particular house.

    3. Average snowfall is meaningless at the shore area. Atlantic City International Airport averages 17.3 inches of snow, according to the National Oceanic and Atmospheric Administration. However, since records began in 1944, four winter seasons had less than an inch of snow, and six were buried in more than 40 inches of snow.

    4. The ocean, which keeps our fall warmer than the New Jersey Turnpike corridor during the fall, also keeps us milder during the winter. An onshore wind with a nor’easter will keep the lawns brown, not white. You have to go to northwestern New Jersey, the Poconos and places north to be guaranteed snow.

    Via @CotentWeatherGuy on X.

    Still, the winter forecast is exciting. It’s the most popular outlook of the year and I love talking about it with you.

    How did last year’s winter forecast do?

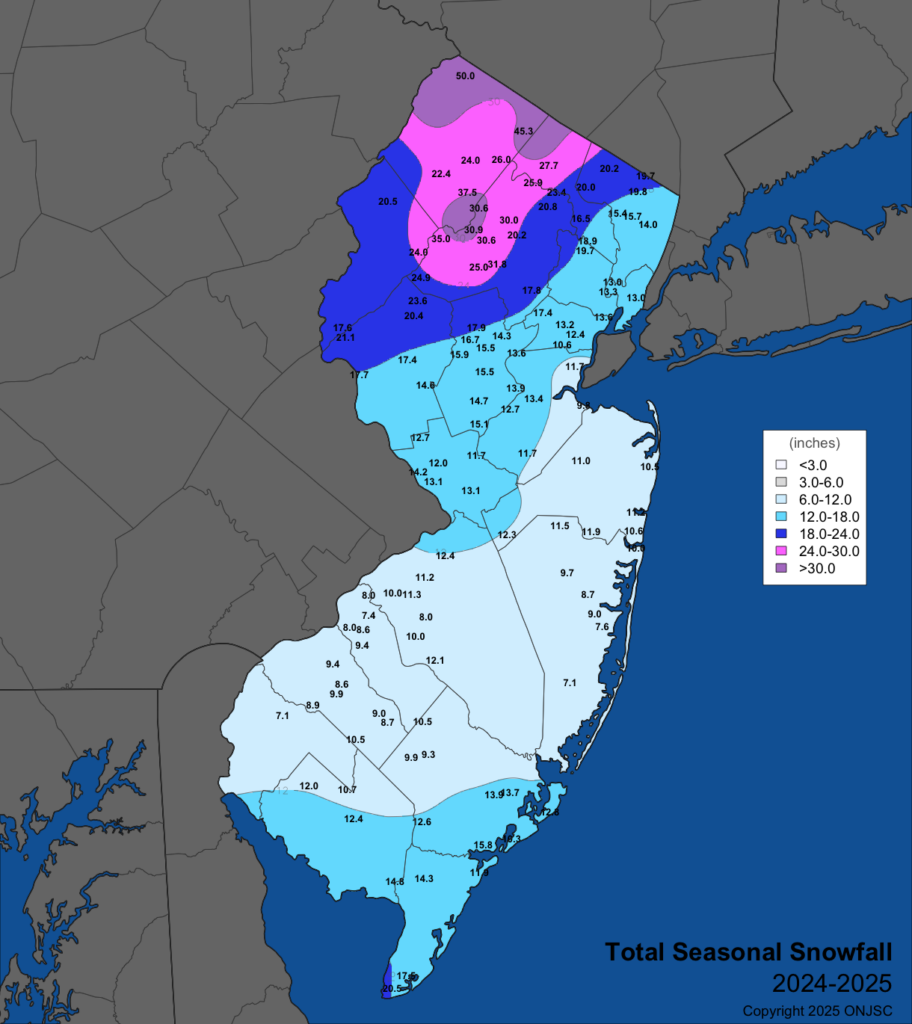
    Lower Township, at the southern end of Cape May County, had the most snow in the entire Jersey Shore area – 20.5 inches fell there. In fact, the only places in the state that were higher were northwest of Interstate 287, in the typically colder northwest New Jersey.

    Otherwise, most of Atlantic, Cumberland and Cape May counties saw between 12 and 18 inches of snow. Farther north, the rest of the shore only had 7 to 12 inches.

    Snowfall totals from the 2024-2025 winter (via The Office of the New Jersey State Climatologist)

    Last year’s forecast column stated: “It’s safe to say that we can expect fewer storms with a possibility of snow.” I gave the shore a 65% chance of snow being 3 inches below the 14.8-inch seasonal snow average at the immediate coast, and the 17.4-inch average for the mainland. Consider it a pretty good forecast.

    The not-so-great forecast was the coastal flooding outlook. I wrote that “near-to-slightly-above-average coastal flooding” was likely. Thank goodness this was wrong. Coastal flooding and beach erosion were nearly nonexistent.

    The column also stated that temperatures would be “warmer than usual overall.” Turns out, our 37.9-degree average from December to March was just above the 30-year climate average of 37.6 at Atlantic City International Airport. At the beaches, the average at Sen. Frank S. Farley State Marina in Atlantic City was 38.9 degrees – below the average of 39.7.

    Quick Jersey Shore winter forecast

    Expect a couple of lighter snow events (less than 4 inches), with a better-than-average chance for bigger storms (4 to 8 inches). However, massive snow of more than a foot is less likely than usual.

    Temperatures should be about average when everything is said and done. However, this should be due to big swings in temperatures averaging out to near average throughout the year. Four days of near-60-degree weather, followed by four days of 30-degree weather, is a strong possibility. Our first sustained cold shot looks to be at some point between Thanksgiving and Christmas.

    Expect more coastal storms than usual. At the risk of sounding wishywashy, some will be mostly rain, and some will be mostly snow.

    Beach erosion and tidal flooding will be more of a quantity than a quality (big issues) thing. However, with the beaches already damaged in spots, it’s a concern.

    Jersey Shore winter forecast in more detail

    The outcomes for this winter will be largely driven by three factors.

    1. Weak La Niña, or colder-than-average water temperatures in the equatorial Pacific Ocean.

    2. Much warmer-than-average water temperatures in the Pacific Ocean, off the United States West Coast.

    3. Less-than-usual Arctic Ocean sea ice in North America.

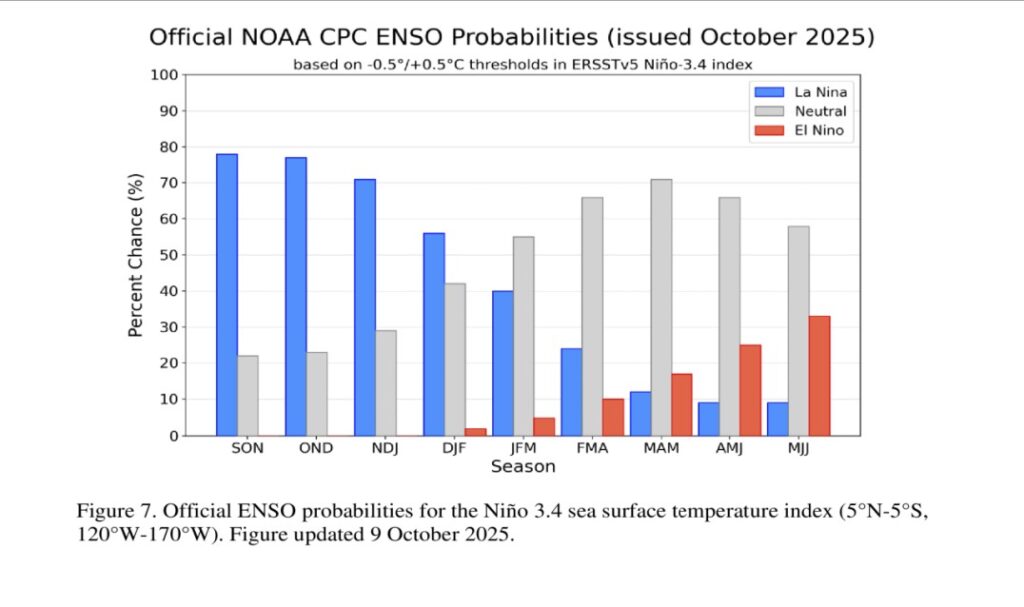
    You can’t start a winter forecast without looking at the state of the El Niño Southern Oscillation. This explains whether water temperatures in the equatorial Pacific Ocean are warmer or colder than average. We’re in La Niña, so it’s cooler than average.

    NOAA expects La Nina to continue through at least January (DJF).

    However, a weak La Niña is only expected to last until February, according to NOAA. We may then go into a neutral state for the rest of the winter. Either way, the point is La Niña favors a slightly cooler and drier winter.

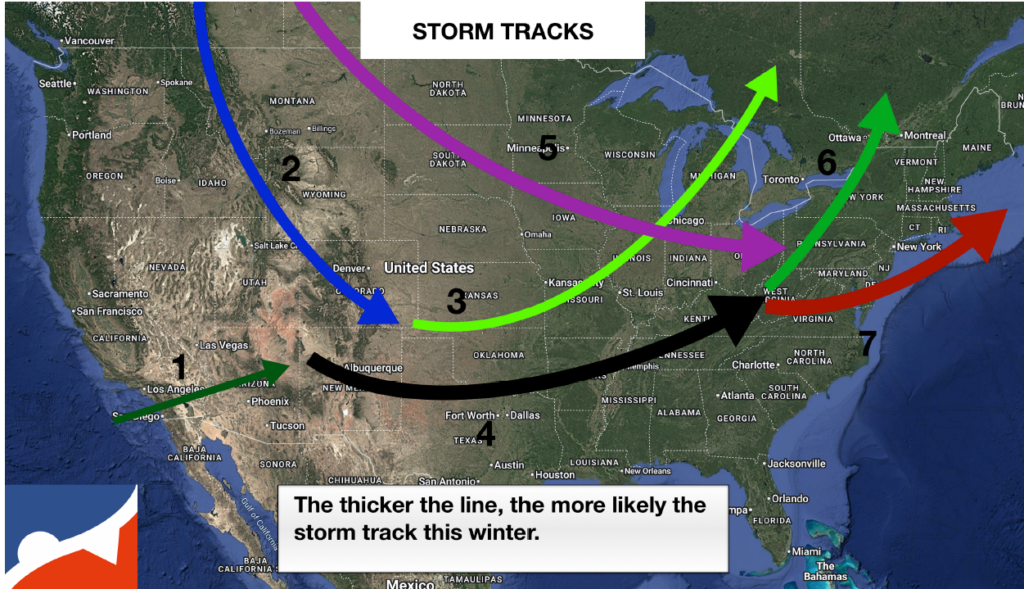
    The next two factors both support stormier-than-usual winter patterns. The relatively warm water off the West Coast supports a storm track right through the Mid-Atlantic. Storms during the winter love a clash of cold and mild, and these line up perfectly for our region to be the battleground.

    Meanwhile, sea ice is well below average on the North American continent. Unless something crazy happens, it will stay this way. That opens the jet stream – the river of air about 30,000 feet high – which is also the storm track, causing it to look like a rollercoaster, snaking south to north over the Eastern United States.

    When the Jersey Shore is on the northern side of the track, storms are mostly snow. When the Jersey Shore is on the southern side of the track, they are mostly rain. Expect to see the classic 55 degrees and rain in Cape May, with 30 degrees and snow in Trenton a few times.

    The seven main storm tracks expected this upcoming winter (via NYNJPAWeather)

    It’s tempting to go above average for snow at the Jersey Shore given all of this, with one or two big snows. However, the coastal storms that do develop off this jet stream will tend to start in Virginia or North Carolina. Even if it is mostly snow for us, they will have a short “runway” as they move northeast to develop heavy precipitation. These are called Miller B storm systems.

    The high number of expected storms increases the likelihood of a few significant snowfalls, ranging from 4 to 8 inches. However, without a storm forming off the coast of Georgia or Florida – known as Miller A storms – it’s unlikely we’ll see major snow accumulations.

    I expect more than the usual number of tidal flooding and beach erosion days. Most of these should be minor to perhaps moderate issues, but with the weakened state of our beaches in some locations, this will bring worse-than-usual impacts. The good news is the New Jersey Department of Environmental Protection believes the sand that was eroded will return by natural processes next spring. It won’t repair the dune cliffs seen along Jersey Shore; it will only fill in the erosion on the more gently sloping sand.

    Being a citizen scientist, for cheap

    The Community Collaborative Rain, Hail and Snow Network (CoCoRaHS) is the nation’s largest group of volunteers in the weather community. Each day, over 200 people in New Jersey and thousands across the United States report on how much precipitation they receive.

    For $50 upfront (to purchase the rain gauge), your observations will be used by many in the weather community. I look at this constantly during storms and would love to see what you have at your home. In fact, New Jersey’s official state record for most yearly precipitation is from a CoCoRaHS gauge.

    We hope to see your reports this winter!

    Joe Martucci, a Certified Broadcast Meteorologist and Digital Meteorologist, is the President and Director of Meteorology for Cup A Joe Weather and Drone. You can connect with him at cupajoe.live/.
  • October Nor’easter brought major beach erosion, and NJ’s just getting started

    October Nor’easter brought major beach erosion, and NJ’s just getting started

    The official post-nor’easter report is in and it paints a stark picture of the sandy Jersey Shore, just as nor’easter season is starting.

    The New Jersey Department of Environmental Protection’s (NJDEP) Office of Coastal Engineering released its Initial Coastal Storm Survey and Damage Assessment of the Oct. 12-13 nor’easter last week.

    After major storms, the office conducts beach erosion assessments along the state’s 210-mile coastline. This includes not just the Atlantic Coast, but also the Delaware Bayshore and the Raritan Bayshore, too. The survey paints an unfortunate picture of the South Jersey shore, with another six months of possible coastal storms still to come.

    How much erosion did the Jersey Shore have?

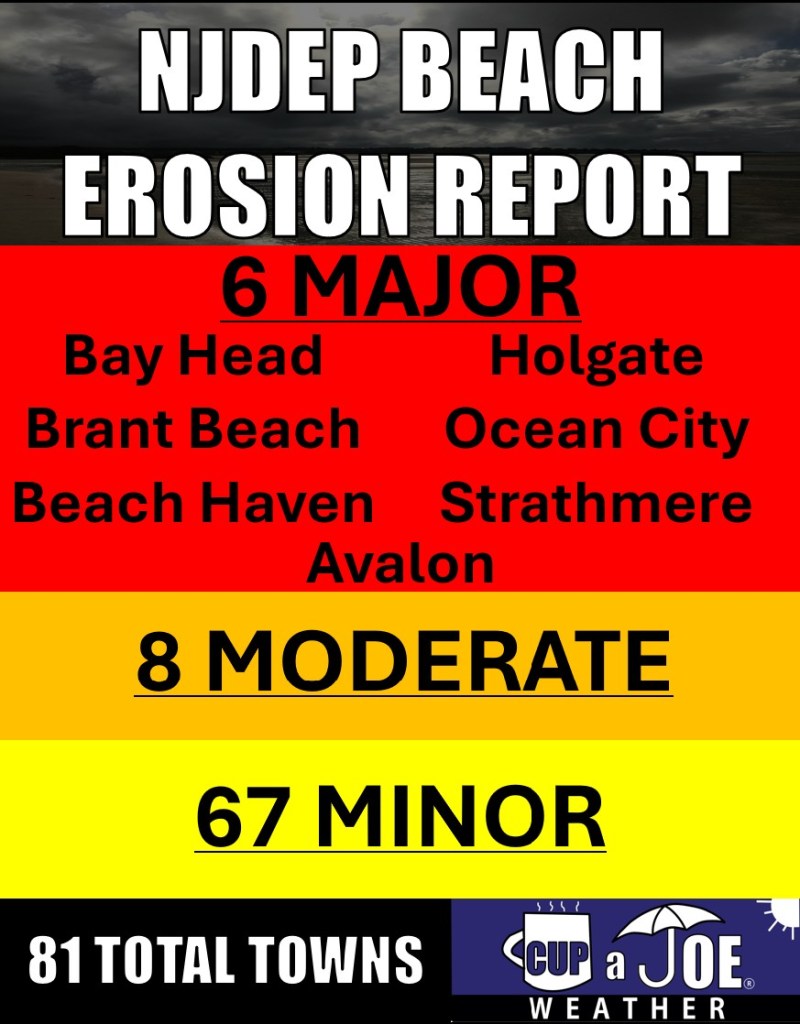
    In the 81 towns that the NJDEP has sent teams out to survey, six had major beach erosion, eight had moderate beach erosion, while 67 towns had minor beach erosion. It could have been worse, that’s for sure. However, the South Jersey Atlantic shore was the hardest hit.

    Ocean City, Strathmere and Avalon all reported major beach erosion. Atlantic City, Stone Harbor and North Wildwood had moderate erosion.

    Note that Brant Beach had moderate erosion, not major. Our error!

    This report is just for the erosion from the Oct. 12-13 storm, and does not consider what happened during Hurricane Erin in August. As it turns out, the nor’easter impacted the beach more than Erin did.

    Note that Brant Beach had moderate, not major erosion. Our error!

    During Erin, no towns experienced major beach erosion, while nine reported moderate erosion. At the same time, Erin produced the highest summertime tidal flooding on record in multiple locations.

    What does major beach erosion look like?

    Strathmere in Upper Township, likely was the hardest-hit location in the state from the nor’easter.

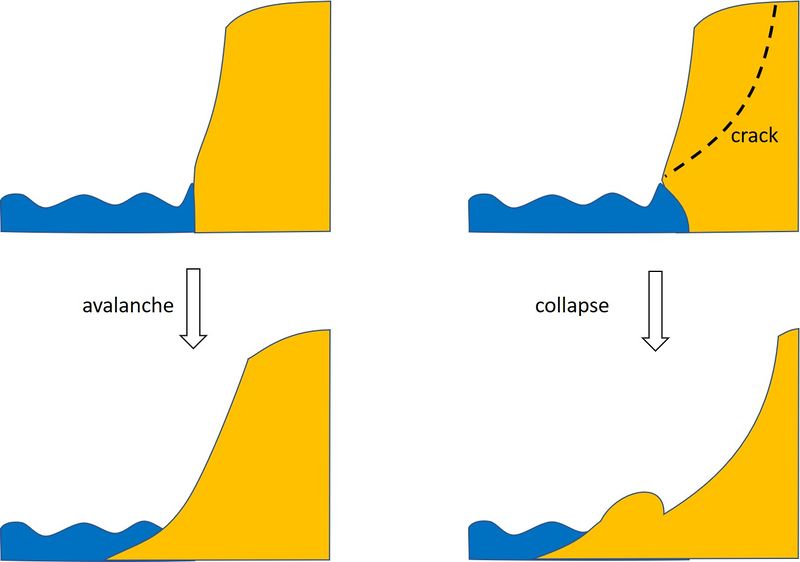
    Dune scarping, or the cliffs of sand created when waves batter the dunes, reach up to 18 feet high, from Seaview Avenue to Sherman Avenue. New cliffs formed on Whale Beach, and the high tide line now reaches the upper beach and dune.

    How sand dunes fail.

    Neighboring Ocean City also endured major beach erosion in parts of town.

    For Ocean City, the NJDEP report describes “moderate sloped erosion throughout the city, with major sloped erosion and vertical dune scarping up to 6 feet in height between First St. to 11th St.”

    Finally, Avalon already had massive cliffs of sand on the north end of town. Now, up to 20-foot cliffs are present between 10th and 15th streets, as well as 17th to 25th streets. Also, the retaining wall, between 11th and 15th streets, is exposed to the open air and ocean.

    Is the beach erosion permanent?

    The NJDEP does not believe so.

    “…much of the material eroded from the ‘dry’ beach area has not been lost, but rather redistributed within the beach profile system, such as creation or enlargement of offshore sand bars. Our expectation is that much of this material will return to the ‘dry’ beach in time following the storm,” states the report from the Oct. 12-13 nor’easter.

    Whether that returns in a few weeks, a few months or more is to be determined, though. Shore Local News has reported that Rep. Jeff Van Drew (R-2nd) is working to establish a trust fund using revenues from offshore energy leases to permanently fund beach replenishment. As of this writing, there is no federal funding for beach replenishment in 2026.

    Beaches are weak going into nor’easter season

    I wrote that after Hurricane Erin, our beaches were in a poor spot when it comes to sand and coastal protection, given the time of year. The October nor’easter only weakened them further.

    Nor’easters typically occur between mid-October and mid-April. So, with five and a half months left to go, there is a high likelihood that another storm, or storms, will chew up the beaches even more. I’ll report on the winter forecast in the first half of November. One thing I’m watching is the track of a coastal storm this week.

    The atmosphere, like human bodies, has muscle memory. In the human body it’s due to the nervous system and practice. In weather, it has to do with physics as well as boundaries between warm and cold air.

    If this week’s storm takes a path similar to the Oct. 12-13 nor’easter, we’ll see more beach erosion. You can also expect more storms to do the same.

    Streaming Weather Channel Almost Ready

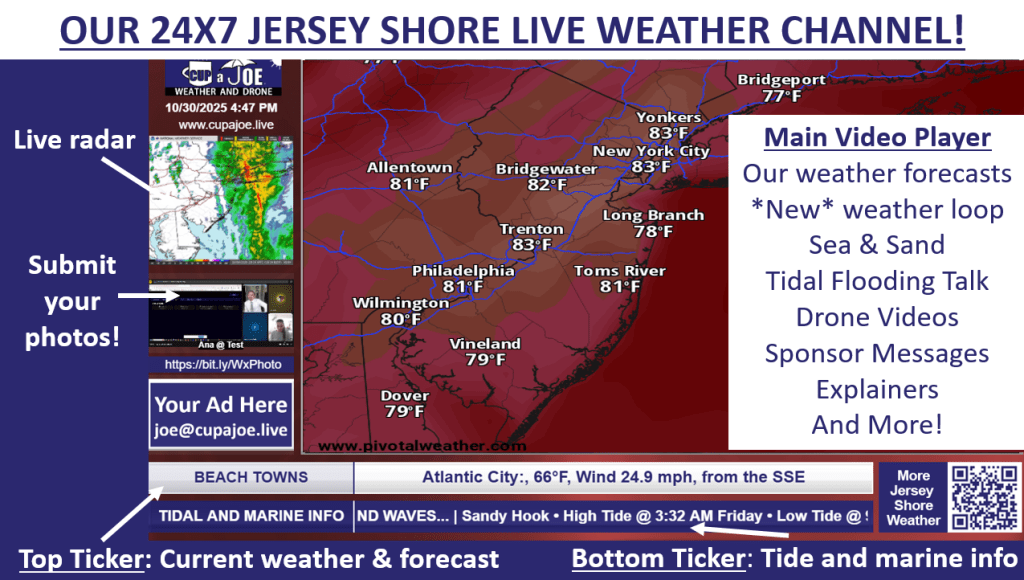
    Coming soon is the Jersey Shore’s 24×7 streaming weather channel. All the daily forecast videos, weather updates like this, drone footage, words from our sponsors and more will be on there. You’ll love our feature that allows you to send your best weather photos right to the streaming channel. Find it on my YouTube channel, joemartwx or on www.cupajoe.live.

    Joe Martucci, a Certified Broadcast Meteorologist and Digital Meteorologist, is the President and Director of Meteorology for Cup A Joe Weather and Drone. You can connect with him at cupajoe.live/.
  • NJ Nor’easter brings top 10 highest tide, record rain, erosion

    NJ Nor’easter brings top 10 highest tide, record rain, erosion

    This article initially appeared in Shore Local magazine on Oct. 16

    It ripped, roared and, most consequentially, flooded. The first nor’easter of the 2025-2026 cool-weather season may very well turn out to be the most powerful one. Here are the most impressive storm stats to me for the Jersey Shore and beyond.

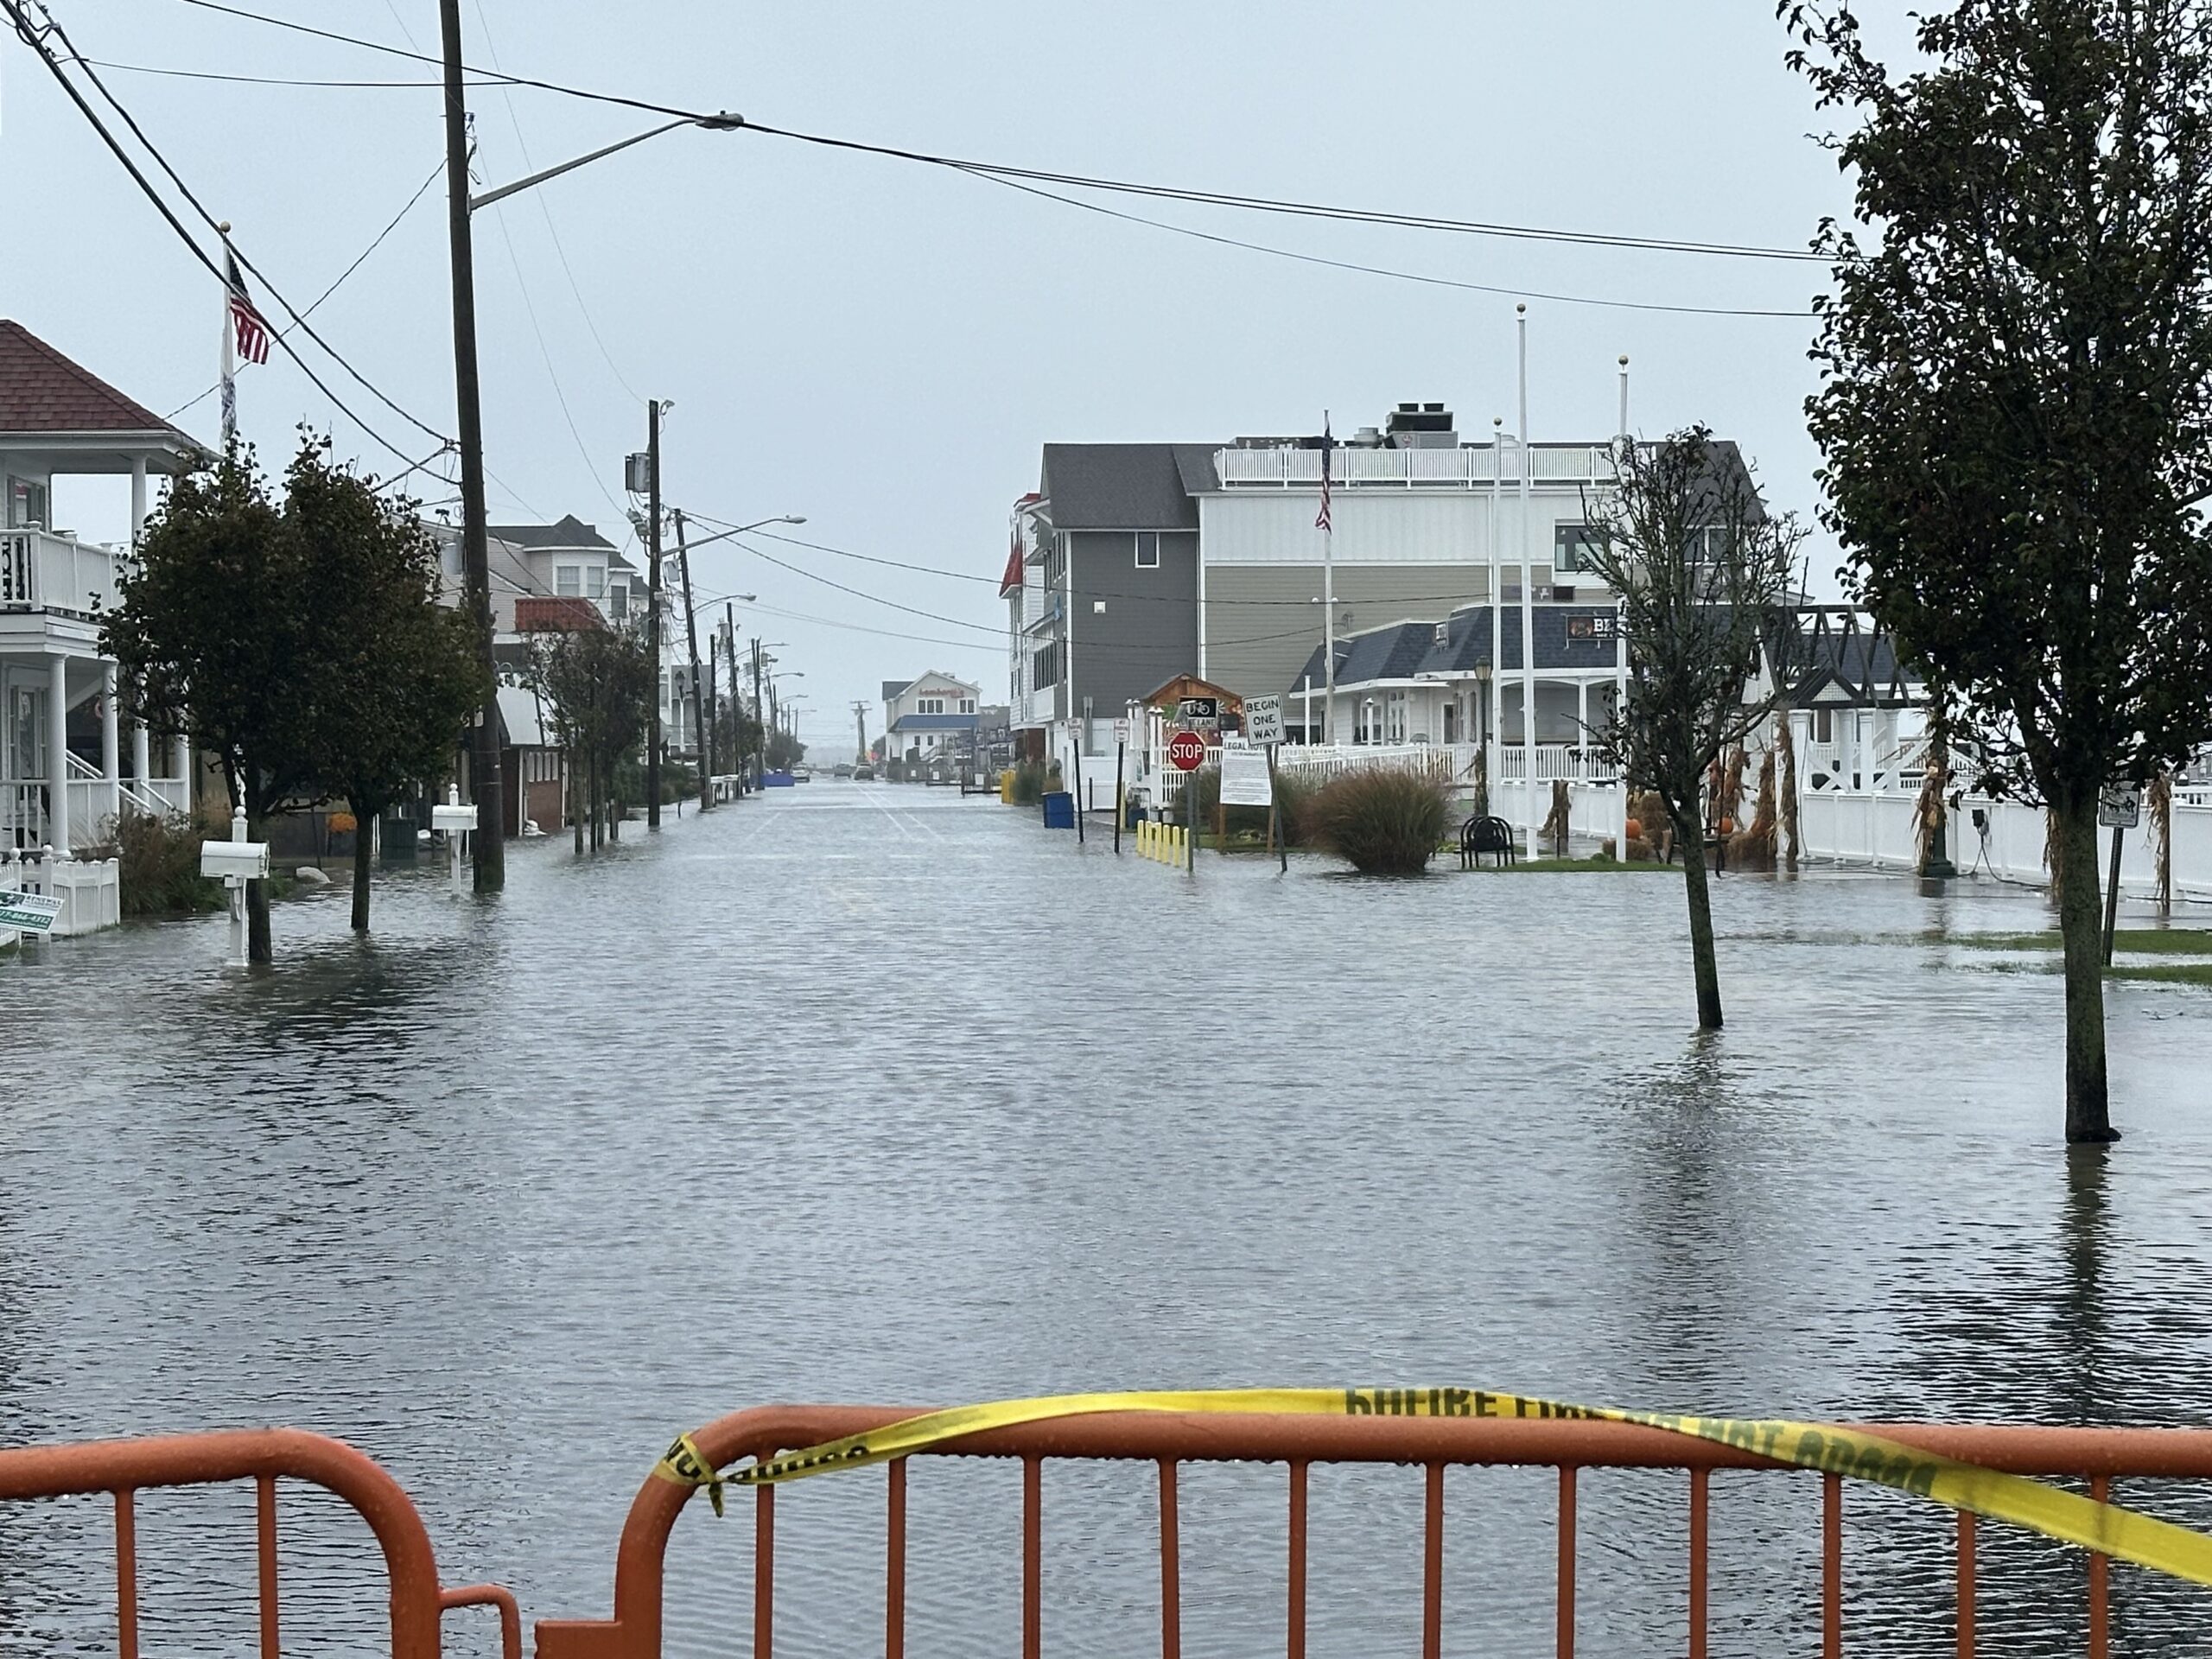
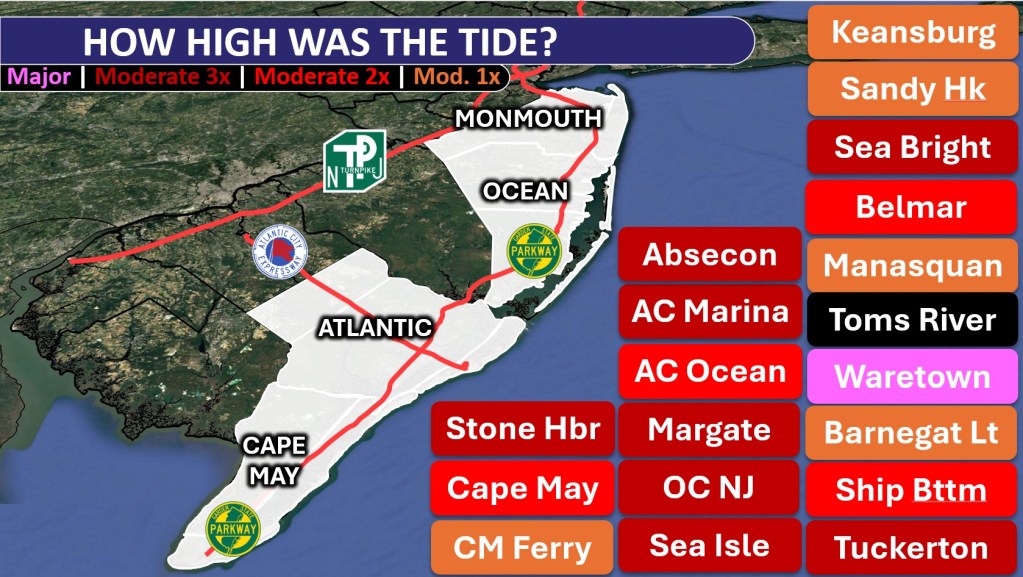
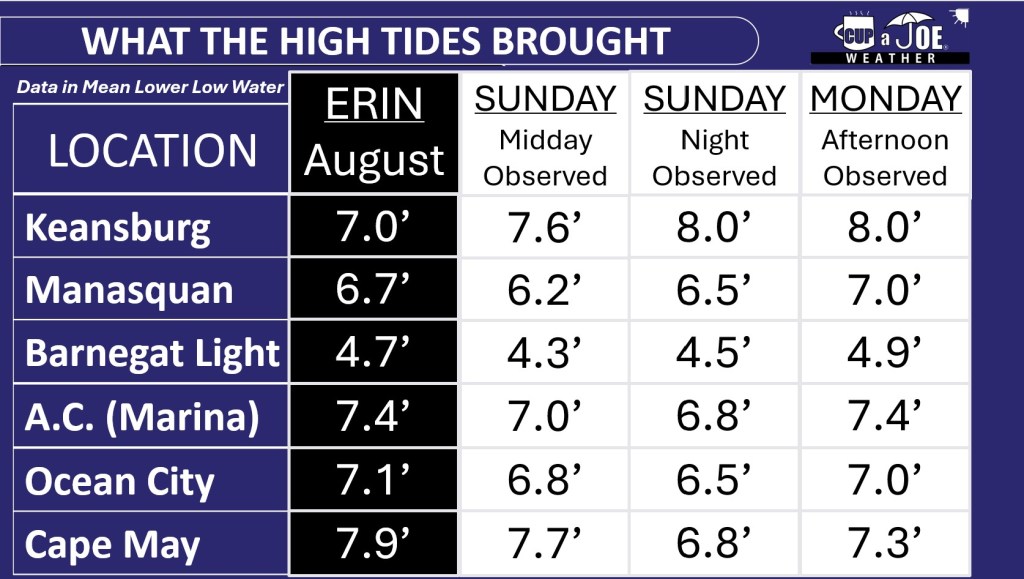
    – The Sunday or Monday afternoon high tide was in the top 10 highest on record for nearly everywhere, from Cape May up to southern Monmouth County, according to the National Oceanic and Atmospheric Administration.

    – Most of Cape May and Atlantic counties saw three consecutive tides in moderate flood stage.

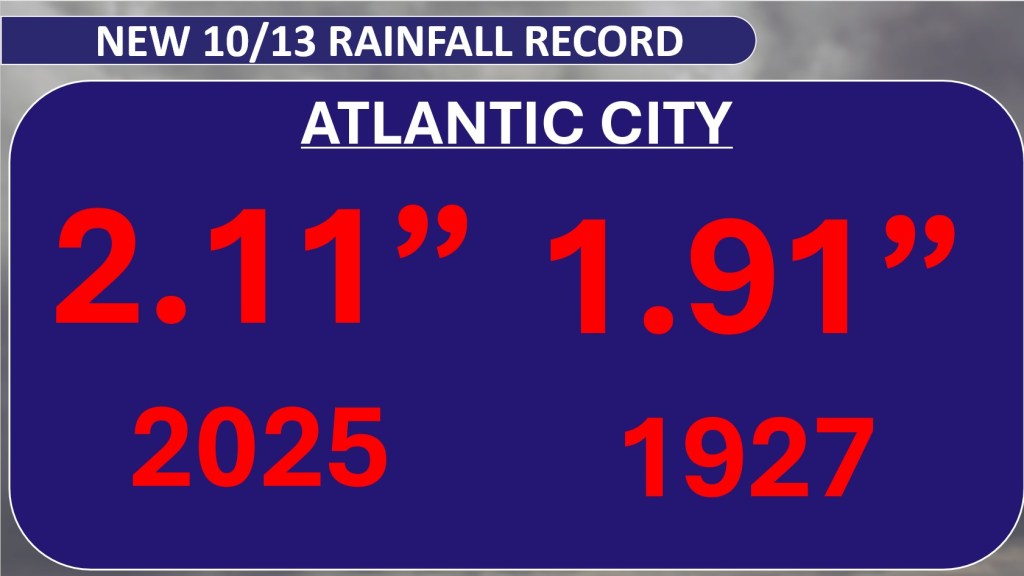
    – Sen. Frank S. Farley State Marina broke a daily rainfall record that had stood since 1927.

    Plus, while we will remember this as a nor’easter, there were tropical characteristics to this storm, too. Let’s explain the details for all of this.

    How severe were the tides at the Jersey Shore?

    Atlantic City Marina had its fifth highest tide on record, peaking at 7.4 feet above mean lower low water, the average height of the two lowest low tides Monday afternoon.

    Ocean City had its sixth highest tide on record, reaching 7.0 feet above mean lower low water Monday.

    Down near Exit 0 in Cape May, the ninth highest tide on record, peaking at 7.7 feet above mean lower low water, was experienced on Sunday.

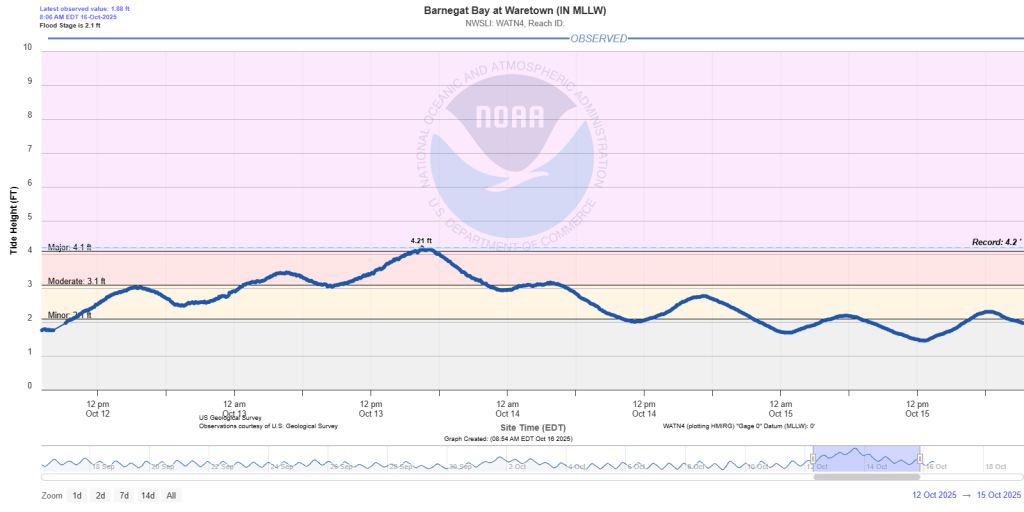
    Ocean County ended up having the highest tides. Barnegat Light in the northern part of Long Beach Island, had the fourth highest tide on record. Meanwhile, across the Barnegat Bay in Waretown, 3 feet of water was recorded in the lowest-lying areas — their worst recorded tide.

    Tide heights in Waretown, Ocean County, on the Barnegat Bay from Oct. 12 to Oct. 15. The 4.21 foot above mean lower low water is the highest in its recorded history (data via the National Oceanic and Atmospheric Administration).

    Farther north Manasquan, Monmouth County, had its 10th highest tide. The least severe flooding was on the Raritan Bayshore. They stayed in minor flood stage.

    There is a caveat to all of this. These records only go back to 2000 at the earliest. So it doesn’t count the 1991 or 1992 nor’easters, the 1962 Ash Wednesday storm or the 1944 hurricane, among others. However, there have been roughly 9,100 days between 2000 and fall 2025. This tide ranks in the top 0.1%. That’s impressive.

    To put things in perspective, it helps to have a recent event with which to compare the storm, so let’s consider Hurricane Erin.

    In late August, Erin brought the highest storm surge on record to the following locations: Absecon, Atlantic City (Inside Thorofare), Sea Isle City, Avalon, Stone Harbor and Cape May (bayside), according to NOAA.

    For the South Jersey shore, south of Long Beach Island, the highest tide stayed near Erin’s height, whether it happened on Sunday or Monday afternoon. North of LBI, at least one of the two tides from the nor’easter were higher than Erin.

    The South Jersey shore could have been worse. Thankfully, winds on Monday morning were from the northwest — offshore — which pushed some of the water out. Had they been northeast, like the rest of the Jersey Shore was, towns like Ocean City and Somers Point would have had tides higher than Erin on Monday afternoon, pushing into major flood territory.

    How much beach erosion occurred at the Jersey Shore?

    The exact details won’t be known until towns and the Army Corps of Engineers complete their post-storm surveys. However, expect to hear that issues are widespread and severe for a few.

    Towns already have stark cliffs of sand on the beach from Erin in August. Tack on additional erosion from a storm in September, and our sand infrastructure was already worse than it would be this time of the year going into the Oct. 12-13 storm.

    I imagine every beach town has more erosion than they’d like to stomach for it being so early in the erosion season. Hopefully, this winter and next spring will have fewer nor’easters than usual.

    Gusts over 60 mph

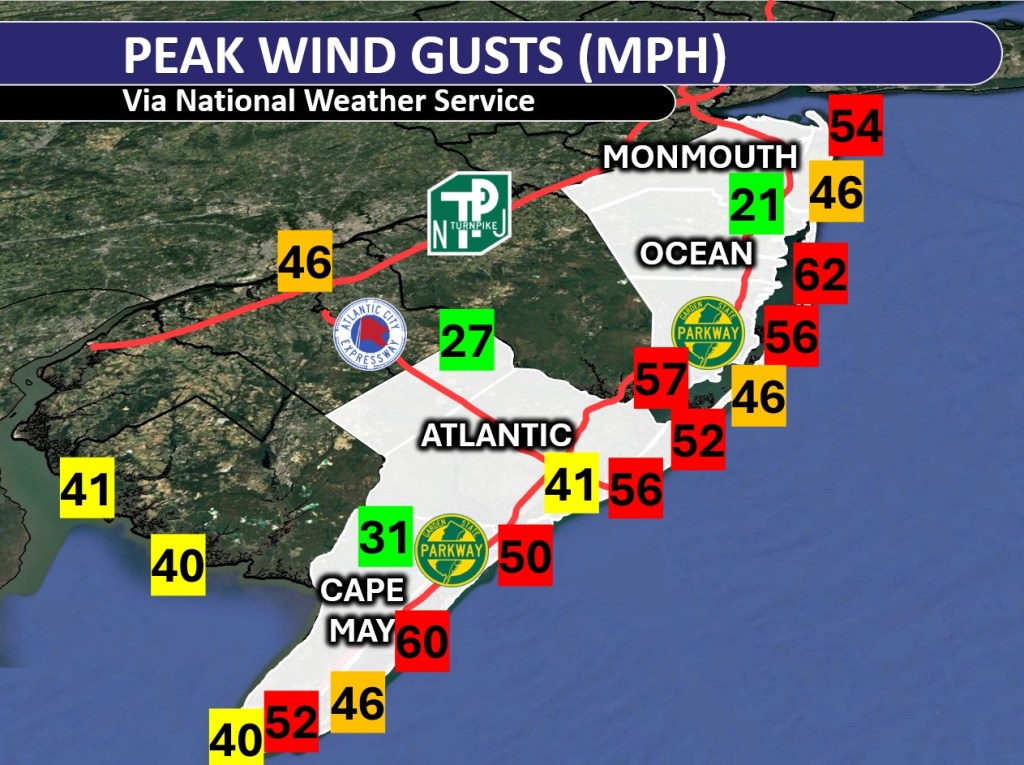
    Wind gusts over 45 mph were widespread east of the Garden State Parkway, and on the bayshores. Island Beach State Park in Ocean County had the highest reported wind gusts, with 62 mph recorded at an Office of the New Jersey State Climatologist weather station. However, Avalon in Cape May County and Surf City in Ocean County also touched 60 mph.

    Here are some other top gusts:

    Atlantic City – 56 mph

    Brigantine – 52 mph

    Cape May Harbor – 52 mph

    Ocean City – 50 mph

    The sustained winds, or constantly blowing ones, made for whistling trees and rattling outdoor furniture Sunday and Monday. Generally, it was 20 to 30 mph at the shore.

    Gusts were much weaker inland. Woodbine in Cape May County reached 31 mph, and Hammonton in Atlantic County only got up to 27 mph.

    Rain was heavy, too

    Rain was the least of our concerns with this storm, but we still had a soaking; that is, east of the Garden State Parkway. Atlantic City Marina broke an Oct. 13 daily rainfall record with 2.11 inches of rain, beating the previous record set back in 1927, according to the NOAA.

    Generally, rainfall totals were between 2 and 3 inches in Atlantic County. Cape May County generally had 1 to 2 inches of rain.

    Once you got away from the four coastal counties — Cape May, Atlantic, Ocean and Monmouth — rainfall measured only up to an inch. Out near Trenton and Philadelphia, it was less than a half inch.

    Jersey Shore streaming weather channel

    I am targeting a launch date between Oct. 18 to 21 for the Jersey Shore’s streaming weather channel. Thanks to Sparkable (who also run the Shore Local website), everything Jersey Shore weather, with a little drone, will be on my YouTube channel and website for your viewing pleasure.

    Tide and marine forecasts, current conditions, forecast videos, radar and support from our sponsors will all be on there. I also want to see your Jersey Shore photos! Submit your sunrises, snow, thunderstorms and fall foliage to be featured in a special shot on the livestream.

    Keep it on your smart TV or computer all day long. Stay tuned for more details.

  • 2025’s Ocean was so Warm in NJ, It Almost Broke a Record

    2025’s Ocean was so Warm in NJ, It Almost Broke a Record

    The summer tide came rolling in this year much warmer than 2024. In fact, the water we enjoyed was tropical enough to be one of the warmest on record at the Jersey Shore.

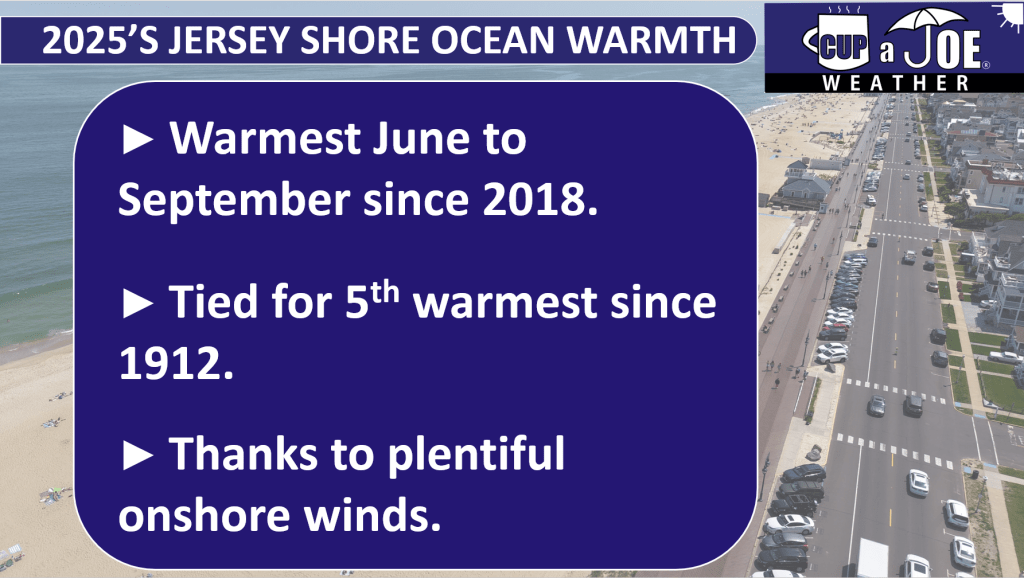
    From June to September, peak beach season, the ocean water temperature from the gauge at Atlantic City’s Steel Pier averaged 71.4 degrees. That is tied with 1951 for the fifth warmest season since records began in 1912.

    This was exactly five degrees warmer than last year, at 66.4 degrees. Remember last year? The water was cold. You sweated on the sand but shivered in the ocean.

    June and July had zero days with a water temperature above 75 degrees last year in Atlantic City. In fact, 11 July days were in the very chilly 50s, and 55 degrees was the 8 a.m. water temperature on July 18, 2024.

    The old saying, “life’s at ease with an ocean breeze” is true. Wind direction all summer, and Locals’ Summer September long, play the critical role to this top five ranking.

    There are three main factors that drive water temperatures.

    The Sun: In spring and summer, the sun is higher in the sky, so it warms up the ocean water faster. In fall and winter, the sun is lower, so the water stays cooler.

    The Currents: In New Jersey, there is a warm ocean current called the Gulf Stream. It starts near Florida and flows all the way to Europe. It does not always reach New Jersey, but sometimes its swirls, bringing warmer water to the shore.

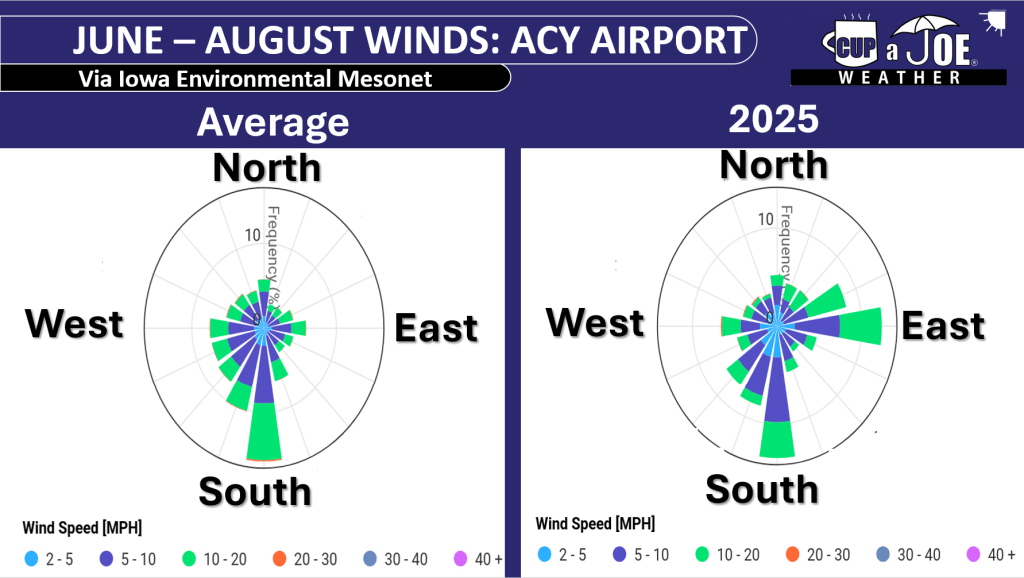
    Wind Direction: Winds that blow from the east, called onshore winds, push warmer ocean water toward the beach. But winds from the south or southwest bring colder water. When winds blow along the shore, they can cause something called Ekman Pumping. This pushes warm surface water away and pulls up colder water from the bottom of the ocean, where we swim.

    While the sun and currents are constant, the wind direction varies day by day, month to month and, for purposes of this article, year by year. This is why it was warmer.

    Onshore winds blew 30% of the time between June and August at Atlantic City International Airport in Egg Harbor Township this year, our closest NOAA weather station with wind direction to Atlantic City.

    The average is 15%. In other words, we had double the number of onshore winds as usual.

    September was the same, with onshore winds roughly 38% of the time in 2025. 27% is the average.

    Those extra onshore winds pushed in some warmer water from the Gulf Stream and limited the amount of colder upwelling. It also led to an August that was cooler than average on land and just about average during September, according to New Jersey State Climatologist Dave Robinson, my other weather dad. Insert YouTube video here.

    The average June to September water temperature is 68.6 degrees. June was the only one below average, at 65.8 degrees. That is not a surprise. However, July (72.9), August (74.8), September (72.1) were all above average.

    If you had to compare it, the sea surface temperatures you experienced this season were more like an average season for Virginia Beach.

    August 16 and 17 were the warmest water days, staying above 80 degrees. June 1 itself had the coldest water, staying below 60 degrees. No surprise there, as the sun is trying to heat up the water.

    We are Going Live!

    Also, I am extremely excited to say that the Jersey Shore’s first 24×7 livestreaming weather channel is going live soon! Thanks to Sparkable (who also runs the Shore Local Website), everything Jersey Shore weather, with a little drone, will be on my YouTube channel and website for your viewing pleasure.

    Tide and marine forecasts, current conditions, forecast videos, radar, and support from our sponsors will all be on there. I also want to see your Jersey Shore photos! Submit your sunrises, snow, thunderstorms and fall foliage to be featured in a special shot on the livestream.

    Keep it on your smart TV or computer all day long. Stay tuned for more details.

  • The Fujiwhara Effect: When 2 tropical cyclones collide

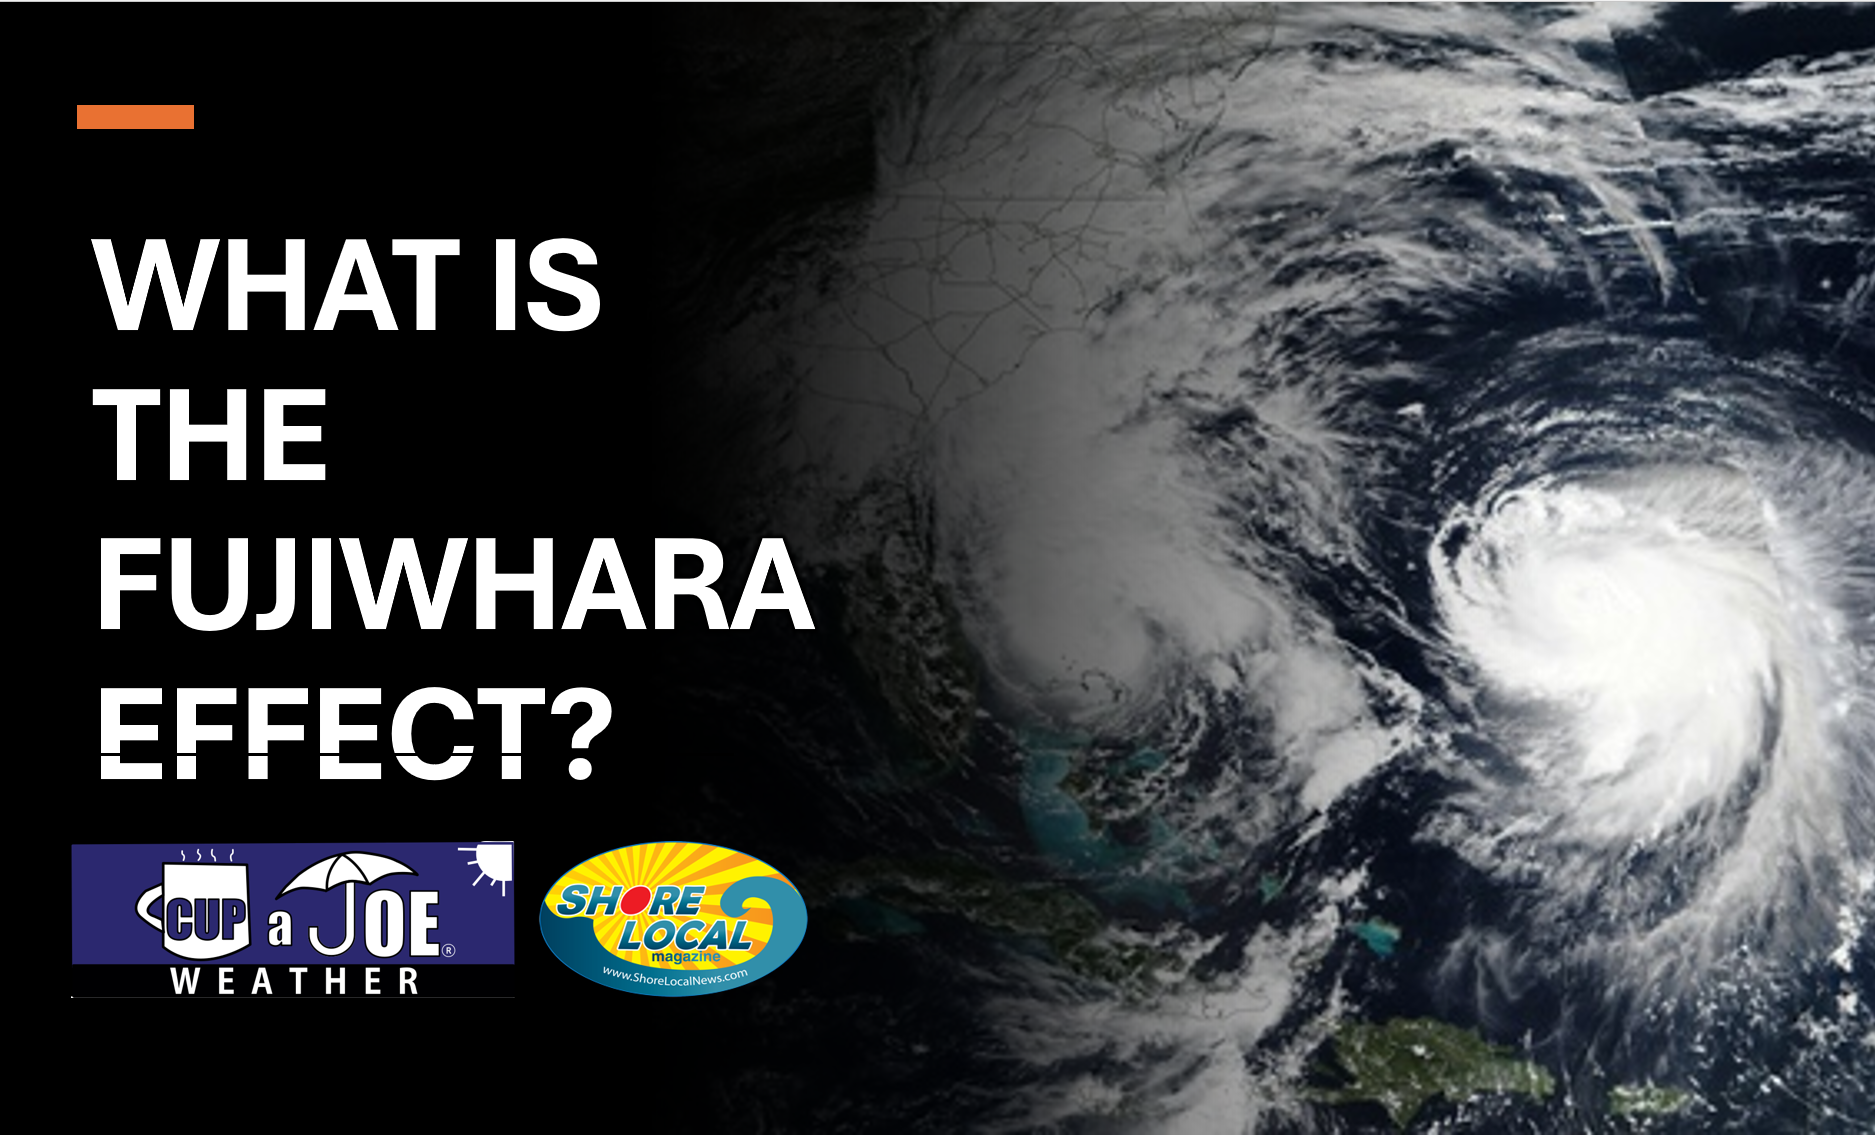
    The Fujiwhara Effect: When 2 tropical cyclones collide

    This article initially appeared in Shore Local News on 10/2/2025. The article was update to include more current information from Imelda and Humberto on 10/2/2025

    Last week, I mentioned on my digital and social weather channels that Hurricanes Humberto and Imelda could undergo a rare interaction called the Fujiwhara Effect.

    Humberto and Imelda partially made this happen, but not completely. Either way, it doesn’t matter for our Jersey Shore weather forecast. A powerful arctic, high-pressure system kept the rain away from these two storms. However, there were gusts to 40 mph and coastal flooding on Oct. 1 and bad surf continues into the weekend.

    The Fujiwhara Effect, like polar vortex, heat dome and derecho before it, brings a new weather word into public discourse. And for your Shore Local meteorologist, it means I get pumped to explain a new-to-many weather phenomenon.

    What is the Fujiwhara Effect?

    “The tendency of two nearby tropical cyclones to rotate cyclonically about each other as a result of their circulations’ mutual advection,” The American Meteorological Society’s Glossary of Meteorology says. However, let us break that down even more.

    Think of the Fujiwhara Effect as a square dance. Instead of pairs of dancers, they are pairs of tropical storms or hurricanes.

    In square dancing, pairs of dancers spin and move in patterns together. The same is true with the Fujiwhara Effect. Instead of a caller’s instructions, though, storms follow nature’s rules.

    Technically, the Fujiwhara Effect happens when storms are within 900 miles of each other’s circulation. That is the distance from Ocean City, N.J., to Tampa, Fla. That is not much in the vast expanse of the Atlantic Ocean.

    The two storms’ counterclockwise (Northern Hemisphere) or clockwise (Southern Hemisphere) winds will start to spin closer to each other. Once they are about 200 miles apart, one of three scenarios happens:

    1.           The larger storm will absorb the smaller storm into its circulation.

    2.           The two storms will merge, creating one more powerful storm.

    3.           Both storms will weaken due to the increase in wind shear or change of wind direction with height.

    The Fujiwhara Effect is named after Sakuhei Fujiwhara, a Japanese meteorologist who first described this phenomenon as a theory in a 1921 research paper. Turns out his theory was correct.

    Where does the Fujiwhara Effect occur most often?

    The northern Pacific Ocean is the place where it happens the most, the American Meteorological Society reports.

    The Pacific Ocean, specifically the western Pacific Ocean, is the world’s most active tropical cyclone basin, thanks to its very warm water and humidity. Plus, since the Pacific Ocean is the world’s largest ocean, more storms can simply spin around there, and potentially come into contact with each other.

    It is rare to have the Fujiwhara Effect in the Atlantic Hurricane Basin. Records are not kept on them, but they happen only once every couple of years. Compared to the Pacific Ocean, there is less area for tropical storms or hurricanes to develop.

    Also, our ocean has just one main storm track: Off the West Coast of Africa to the Caribbean Islands, turn north between the United States East Coast and Bermuda, and then northeast into the northern Atlantic Ocean. This gives less opportunity for storms to cross paths.

    Notable Fujiwhara Effect storms

    The Fujiwhara Effect likely took place in the Atlantic Hurricane Basin in 2016 when Hurricane Matthew and Tropical Storm Nicole interacted. They did not fully dance with each other, however, Matthew’s path shifted a bit, which brought major flooding to the East Coast of Florida.

    The last time on record that Atlantic storms underwent a full Fujiwhara Effect was in 1995 with Hurricanes Iris and, fittingly for this article, Humberto. On Aug. 23, 1995, Hurricane Iris was on a northern path from the Lesser Antilles in the tropical Atlantic Ocean. Then it interacted with Humberto. The Fujiwhara Effect took place, jolting Iris 300 miles to the east.

    Both storms weakened with the Fujiwhara Effect. After the interaction, Iris was downgraded to a tropical storm, while Humberto was downgraded from a Category 2 to a Category 1 hurricane.

    In the eastern Pacific Ocean, closer to North America, Hurricanes Hilary and Irwin in July 2017 showed a good example of the Fujiwhara Effect when the two made a full pivot around each other as they moved north up the Mexican coastline.

    The storms did not merge. They ended up weakening, in part due to the Fujiwhara Effect, and in part due to moving over cooler water.

    Joe Martucci, a Certified Broadcast Meteorologist and Digital Meteorologist, is the President and Director of Meteorology for Cup A Joe Weather and Drone. You can connect with him at cupajoe.live/.
  • Despite the quiet, there’s still plenty of 2025’s hurricane season to go

    Despite the quiet, there’s still plenty of 2025’s hurricane season to go

    This article initially appeared in Shore Local Magazine on 9/25
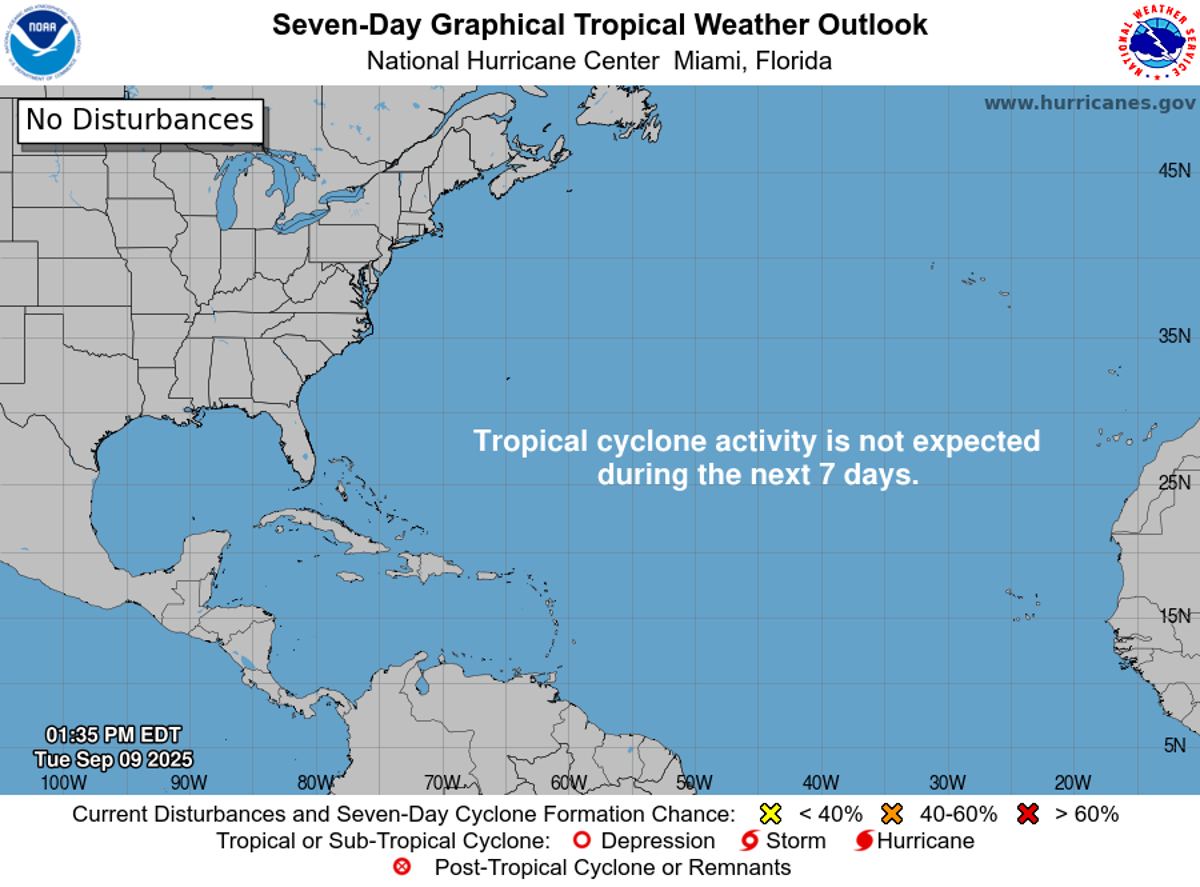
    Thankfully, hurricane season has remained quiet. No major storms have made landfall in the United States, or really anywhere. By the numbers, this is a quieter-than-average year so far. However, don’t be lulled into complacency.

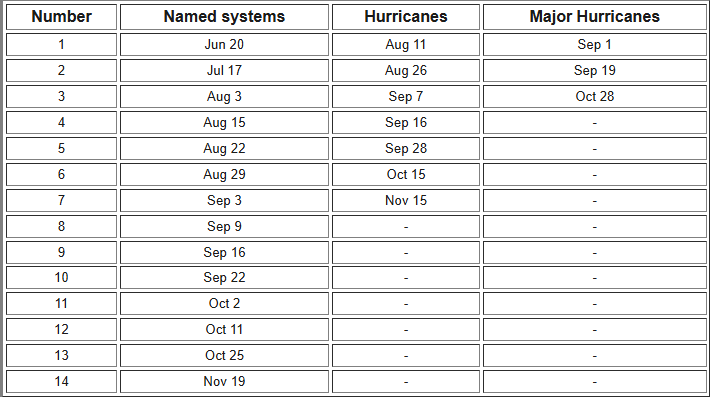
    By late September, the Atlantic Hurricane Season typically reaches its 10th or 11th named storm on average. That would be the “J” or “K” named storm. That’s “Jerry” or “Karen” according to the World Meteorological Organization, which is the group that determines storm names.

    Through Sept. 26 we’re only on Humberto, the eighth storm. She is expected to spin east of Bermuda, well away from the East Coast. New Jersey has seen elevated surf and a risk for rip currents. However, there are no direct impacts.

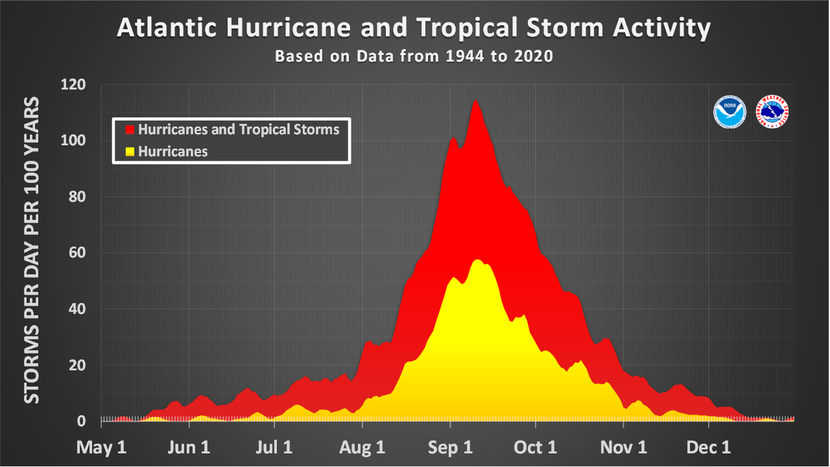
    Average progress of the Atlantic Hurricane Season from 1991-2020. Image via the National Hurricane Center.

    By the Sept. 27-28 weekend, Imelda. That would take us to the ninth named storm. That’s closer to average, but still on the quiet side.

    Now is not the time to be lulled into a sense of security, though. The forecasts for a more-active-than-usual season still have time to come true.

    Sixty percent of tropical activity occurs after Sept. 10 in the Atlantic Ocean, according to the National Hurricane Center, a government agency in Miami, Fla. But it came and went with a whimper. This has been one of only a handful of years when there were no active storms in the Atlantic Hurricane Basin during the season’s peak.

    By late September there is still plenty of hurricane season to go. Sandy, you will recall, made landfall near Brigantine on Oct. 29, 2012. The hurricane season officially runs from June 1 to Nov. 30, so it’s a backloaded season.

    Here’s a look at the latest hurricane forecasts from agencies I highly respect. These forecasts include what has already happened. Through Sept. 22 there have been seven named storms, two hurricanes and one major hurricane – Category 3, 4 or 5 storm.

    National Hurricane Center (from Aug. 7):

    • 13 to 18 named storms
    • 5 to 9 hurricanes
    • 2 to 5 major hurricanes

    Colorado State University (from Aug. 6):

    • 16 named storms
    • 8 hurricanes
    • 3 major hurricanes

    United Kingdom Met Office (from Aug. 1):

    • 16 named storms
    • 6 hurricanes
    • 4 major became

    There’s also something called Accumulated Cyclone Energy (ACE). I like to use this, and you’ll see people using this more often in the future. ACE measures hurricane season energy by adding up storm strength and duration score as it’s going on.

    Colorado State University, as well as the United Kingdom Met Office, issues forecasts for ACE. Both predict a 140-146 ACE index.

    This is all at or just above average. These forecasts still predict that all the activity we’ve had since hurricane season started will be duplicated between now and when the season ends two months from now; other words, just as hurricane season usually goes.

    Have your evacuation plan and get your go bag ready in case you need to leave. In the best case scenario, it will collect dust and stay dry during a quiet New Jersey hurricane season.

    Joe Martucci, a Certified Broadcast Meteorologist and Digital Meteorologist, is the President and Director of Meteorology for Cup A Joe Weather and Drone. You can connect with him at cupajoe.live/.

  • “Average” Fall Foliage expected at the NJ Shore in 2025

    “Average” Fall Foliage expected at the NJ Shore in 2025

    This article initially appeared in Shore Local Newsmagazine on 9/18/2025.
    It will be an “average” year for fall foliage colors this season, the New Jersey Forest Service says. The combination of a wet, late spring; a dry August and September, and cool nights is the key to the 2025 forecast.

    Mike Zsoldos, assistant regional forester for the New Jersey Forest Service, met with me at Double Trouble State Park, located in Bayville, Ocean County, for an interview and drone footage.

    Double Trouble State Park (front), with the Barnegat Bay, the Barnegat Peninsula and the Atlantic Ocean in the distance (Photo by Joe Martucci)

    The park is right off of Garden State Parkway Exit 77. It’s a scenic Pinelands forest known for its Atlantic white cedar trees. Zsoldos said several of the already dwindling trees were destroyed in Superstorm Sandy. However, due to the Atlantic White Cedar Restoration Project, the trees are coming back, helping to offset ground and water pollution.

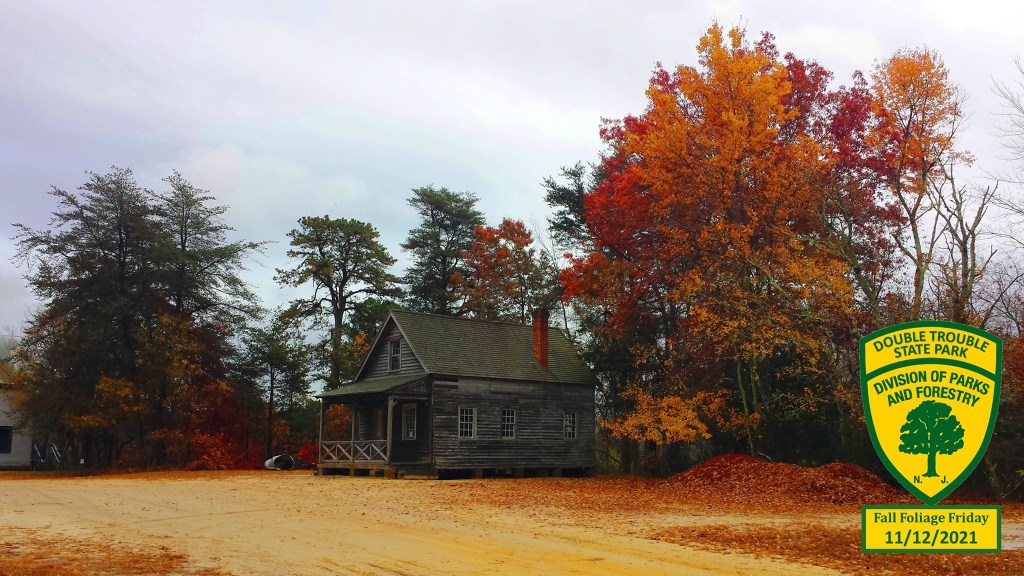
    2021’s Fall Foliage at Double Trouble State Park (New Jersey Division of Parks and Forestry)

    How Double Trouble got its name is up for debate, but the leading theory is that the dam at the village had to be repaired twice in one week due to muskrats. When a townsperson said “here’s more trouble” to a local minister, the minister replied, “yes, double trouble.”

    What ingredients are needed for perfect fall foliage?

    From the time the first green leaves sprout on the branches, to when the last crinkly brown leaf falls to the ground, there are four distinct ingredients that will create the perfect fall foliage season.

    1. From April to June, you want wetter-than-average weather. This gives the trees plenty of nutrients for growing foliage.

    2. Then, during climatological summer, from June to August, you’re looking for no extremes – no extreme heat and no extreme cooldowns, either. If there are, the trees get stressed.

    3. From the beginning of locals summer in September, to the time of peak leaf change, you’re looking for sunny days and cool nights to allow those vibrant fall hues to develop.

    4. Once we reach peak foliage, you’re simply looking for no heavy precipitation or wind. This way, the leaves won’t get blown off the trees early. That gives you plenty of time to enjoy them.

    When does fall foliage typically peak in NJ?

    For most of inland New Jersey, the average peak of fall foliage season is the third to fourth week in October, according to the meteorologist-led ExploreFall.com. At the Jersey Shore, as well as lower Cape May County, it’s early November.

    ExploreFall’s map archive shows that fall foliage tended to peak later in the 2010s than it did in the 1990s. However, New Jersey has returned to more typical timing in the 2020s, aside from last year, which was later than usual.

    How was 2024’s fall foliage in NJ?

    Zsoldos at the Forest Service said last year’s fall foliage was later than average. However, ExploreFall.com shows that it was within seasonable levels. The fall foliage season wound up being dull and quick to change. That was after a very promising April-to-August period, weather wise. Then the longest rain-free streak on record, and most significant drought in years put an end to the vibrant fall potential.

    ‘Average’ fall foliage season expected in NJ this year

    On the vibrant side, there was plentiful rain during the spring to bring the trees the nutrients they need. According to the Office of the New Jersey State Climatologist, 13.17 inches of precipitation fell throughout New Jersey from April to June – climatological spring. The average is 11.75 inches. Moreover, the cooler-than-average weather, which has controlled New Jersey since the beginning of August, produced many cool nights.

    “It’s going to help spark those indicators in trees to tell them it’s time to stop growing and start growing their sugars in the roots for winter (sugars help produce the vibrant colors),” Zsoldos said.

    From July 1 to Sept. 12, Atlantic City International Airport had 24 days with a low temperature at or below 60 degrees, according to the Iowa Environmental Mesonet. That’s more than the average of 16 days. Near Double Trouble State Park at Lakehurst Naval Air Station, there have been 30 such days – the most on record.

    On the other hand, New Jersey still hasn’t fully recovered from the drought which ran from last fall to early this year – the most significant on record. That put stress on the trees early in the growing season. There was also a stretch of extreme heat from June 23 to 25. Inland highs were in the 100s, with even the beaches getting well into the 90s.

    “I think this year, we’re looking at an average fall foliage,” Zsoldos said.

    During my visit with Zsoldos on Sept. 12, he noted the changes in the leaves already seen. He reminds us that fall foliage is a season and not a quick event. He usually sees the first orange and red hues on red maples in early August. You’ll still see a few, vibrant, straggling leaves during Thanksgiving, too.

    As the leaves turn vibrant, we’ll still need heavy rain and fierce winds to stay away from New Jersey to fully enjoy them. Medium-range forecast models lean toward drier weather for October and November. That means fewer opportunities for the rain and wind that would rip the leaves off the trees. It’s good news for leaf peepers.

    A widespread freeze also can quickly shut off the fall foliage process, turning green leaves to dull and brown colors quickly. While there’s always a risk of one night below 32 degrees between now and early November, when fall foliage usually peaks at the shore, there is no strong colder-than-average signal during this time.

    Where are the great spots to view fall foliage in NJ?

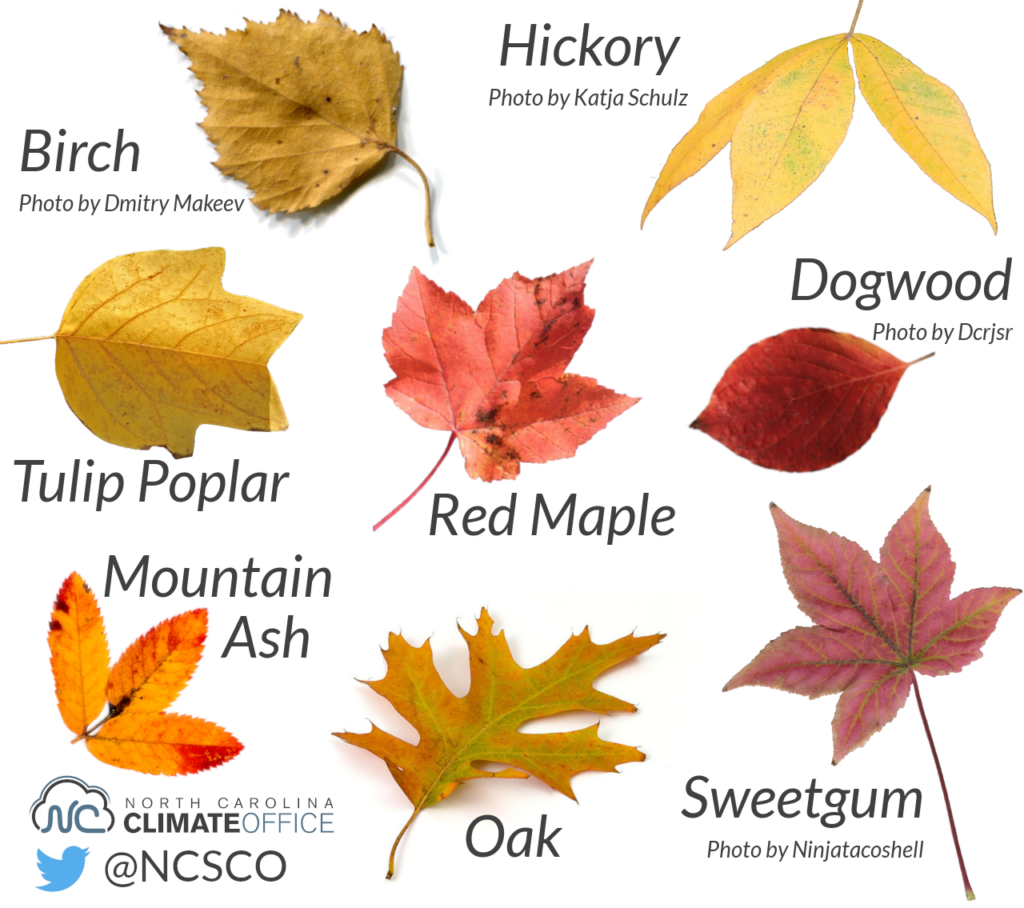
    “Average” is not a bad thing. An average fall foliage season will yield vibrant reds in the oak trees, yellows in the black maples and gold in the hickories across New Jersey, according to the United States Forest Service.

    Types of Fall Foliage, by tree species (North Carolina Climate Office)

    At Double Trouble State Forest, you’ll find excellent walking trails to take in the fall hues. Wharton State Forest is also an excellent spot, allowing visitors to go back in time to historic Batsto Village, and the wide trails and scenic views along the Mullica River.

    One of Double Trouble State Park’s many walking trails (New Jersey Division of Parks and Forestry)

    Birch Grove Park in Northfield is a personal favorite as well. It was home to my first Fall Foliage Forecast in 2017, and the walking trails built over the pond are an excellent way to spend the day.

    Joe Martucci, a Certified Broadcast Meteorologist and Digital Meteorologist, is the President and Director of Meteorology for Cup A Joe Weather and Drone. You can connect with him at cupajoe.live/.