When I talk about this in my weather videos, or post about it on social media, some variation of the same question comes up.
“How could the Jersey Shore be in drought? We had so much snow last winter.”
While yes, we did have well-above-average snowfall (26.1 inches at Atlantic City International Airport, 18.6 inches in Margate, and 39.2 inches in Long Branch), but lots of snow doesn’t necessarily cure a drought. The correlation is pretty weak.
Drought is defined as “a period of abnormally dry weather sufficiently long enough to cause a serious hydrological imbalance,” according to the American Meteorological Society. In other words, if the water going into the environment is less than the water being taken out of the environment (by humans, animals, evaporation, etc.) for a long period of time, you go into drought.
Water comes into the environment by precipitation. Snow is precipitation, so is rain. However, on average in New Jersey, it takes 11 inches of snow to get 1 inch of precipitation. Meanwhile, 1 inch of rain equals 1 inch of precipitation.
Snow to liquid ratio climatology. On average for New Jersey, it takes 10 to 11 inches of snow to produce one inch of precipitation. (via the National Weather Service)
Here’s a look at how much snow, precipitation and average precipitation fell at Atlantic City International Airport from December to February:
In December, there were 2.2 inches of snow, 3.03 inches of precipitation, vs. 3.76 inches of average precipitation.
January saw 6.7 inches of snow, 3.78 inches of precipitation, vs. 3.44 inches of average precipitation.
February recorded 17.2 inches of snow, 3.53 inches of precipitation, vs. 3.12 inches of average precipitation.
Snowfall was about 75% above average during this time. Precipitation was about 5% below average.
What about the snowpack?
This winter probably felt extra long because the snow was on the ground for so long. Twenty-nine days had at least 1 inch of snow covering the ground at Atlantic City International Airport, according to the National Oceanic and Atmospheric Administration, the sixth longest since records began in 1945.
default
Snow on the ground helps prevent drought from worsening. It allows for snow to slowly melt and seep into the ground. It also prevents the sun from pulling water from the ground and evaporating into the atmosphere.
However, the snowpack wasn’t deep enough nor did it hang around long enough to have a significant impact on the drought.
All things considered, it was a lack of precipitation in March that slid the Jersey Shore into a deeper drought.
Drought outlook for NJ
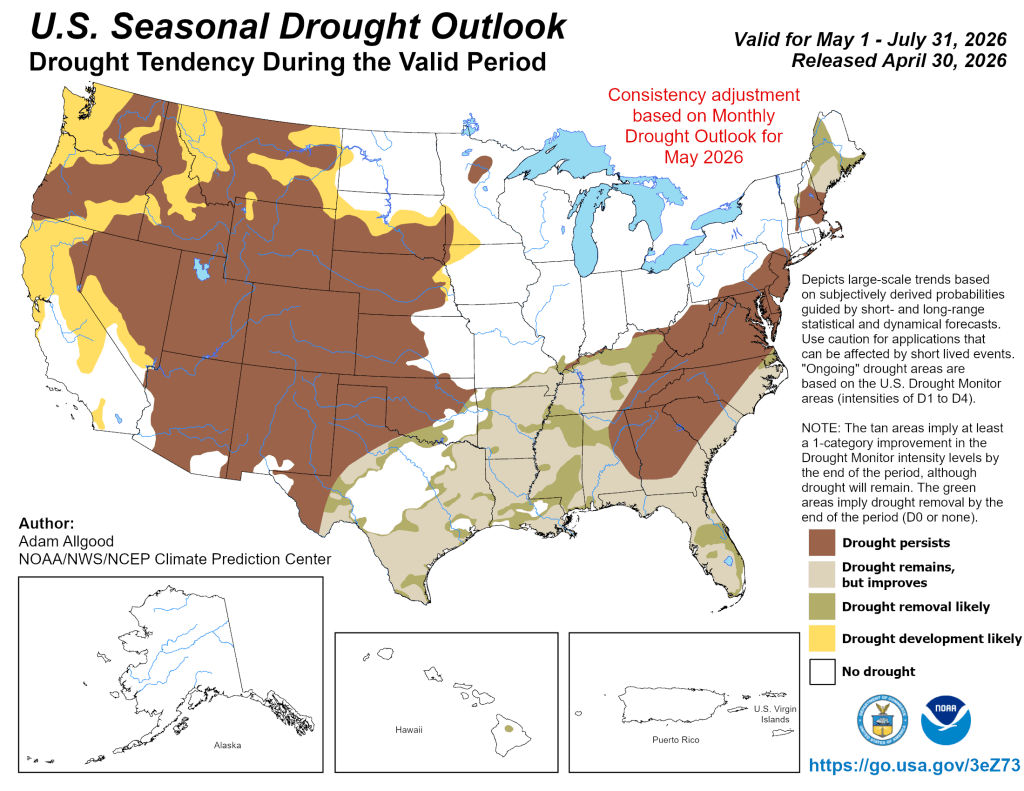
NOAA is forecasting that drought conditions will persist through the end of July, according to its April 30 update.
Precipitation across the Jersey Shore, not just in a town or two, needs to average at least 5 inches during this time in order to drown out the drought. More than 4 inches of evaporation occurs during June and July.
We’ll need a few coastal storms, or a very gloomy next month or two, in order to do that. If not, don’t be surprised to see mandatory water restrictions by the end of the summer.
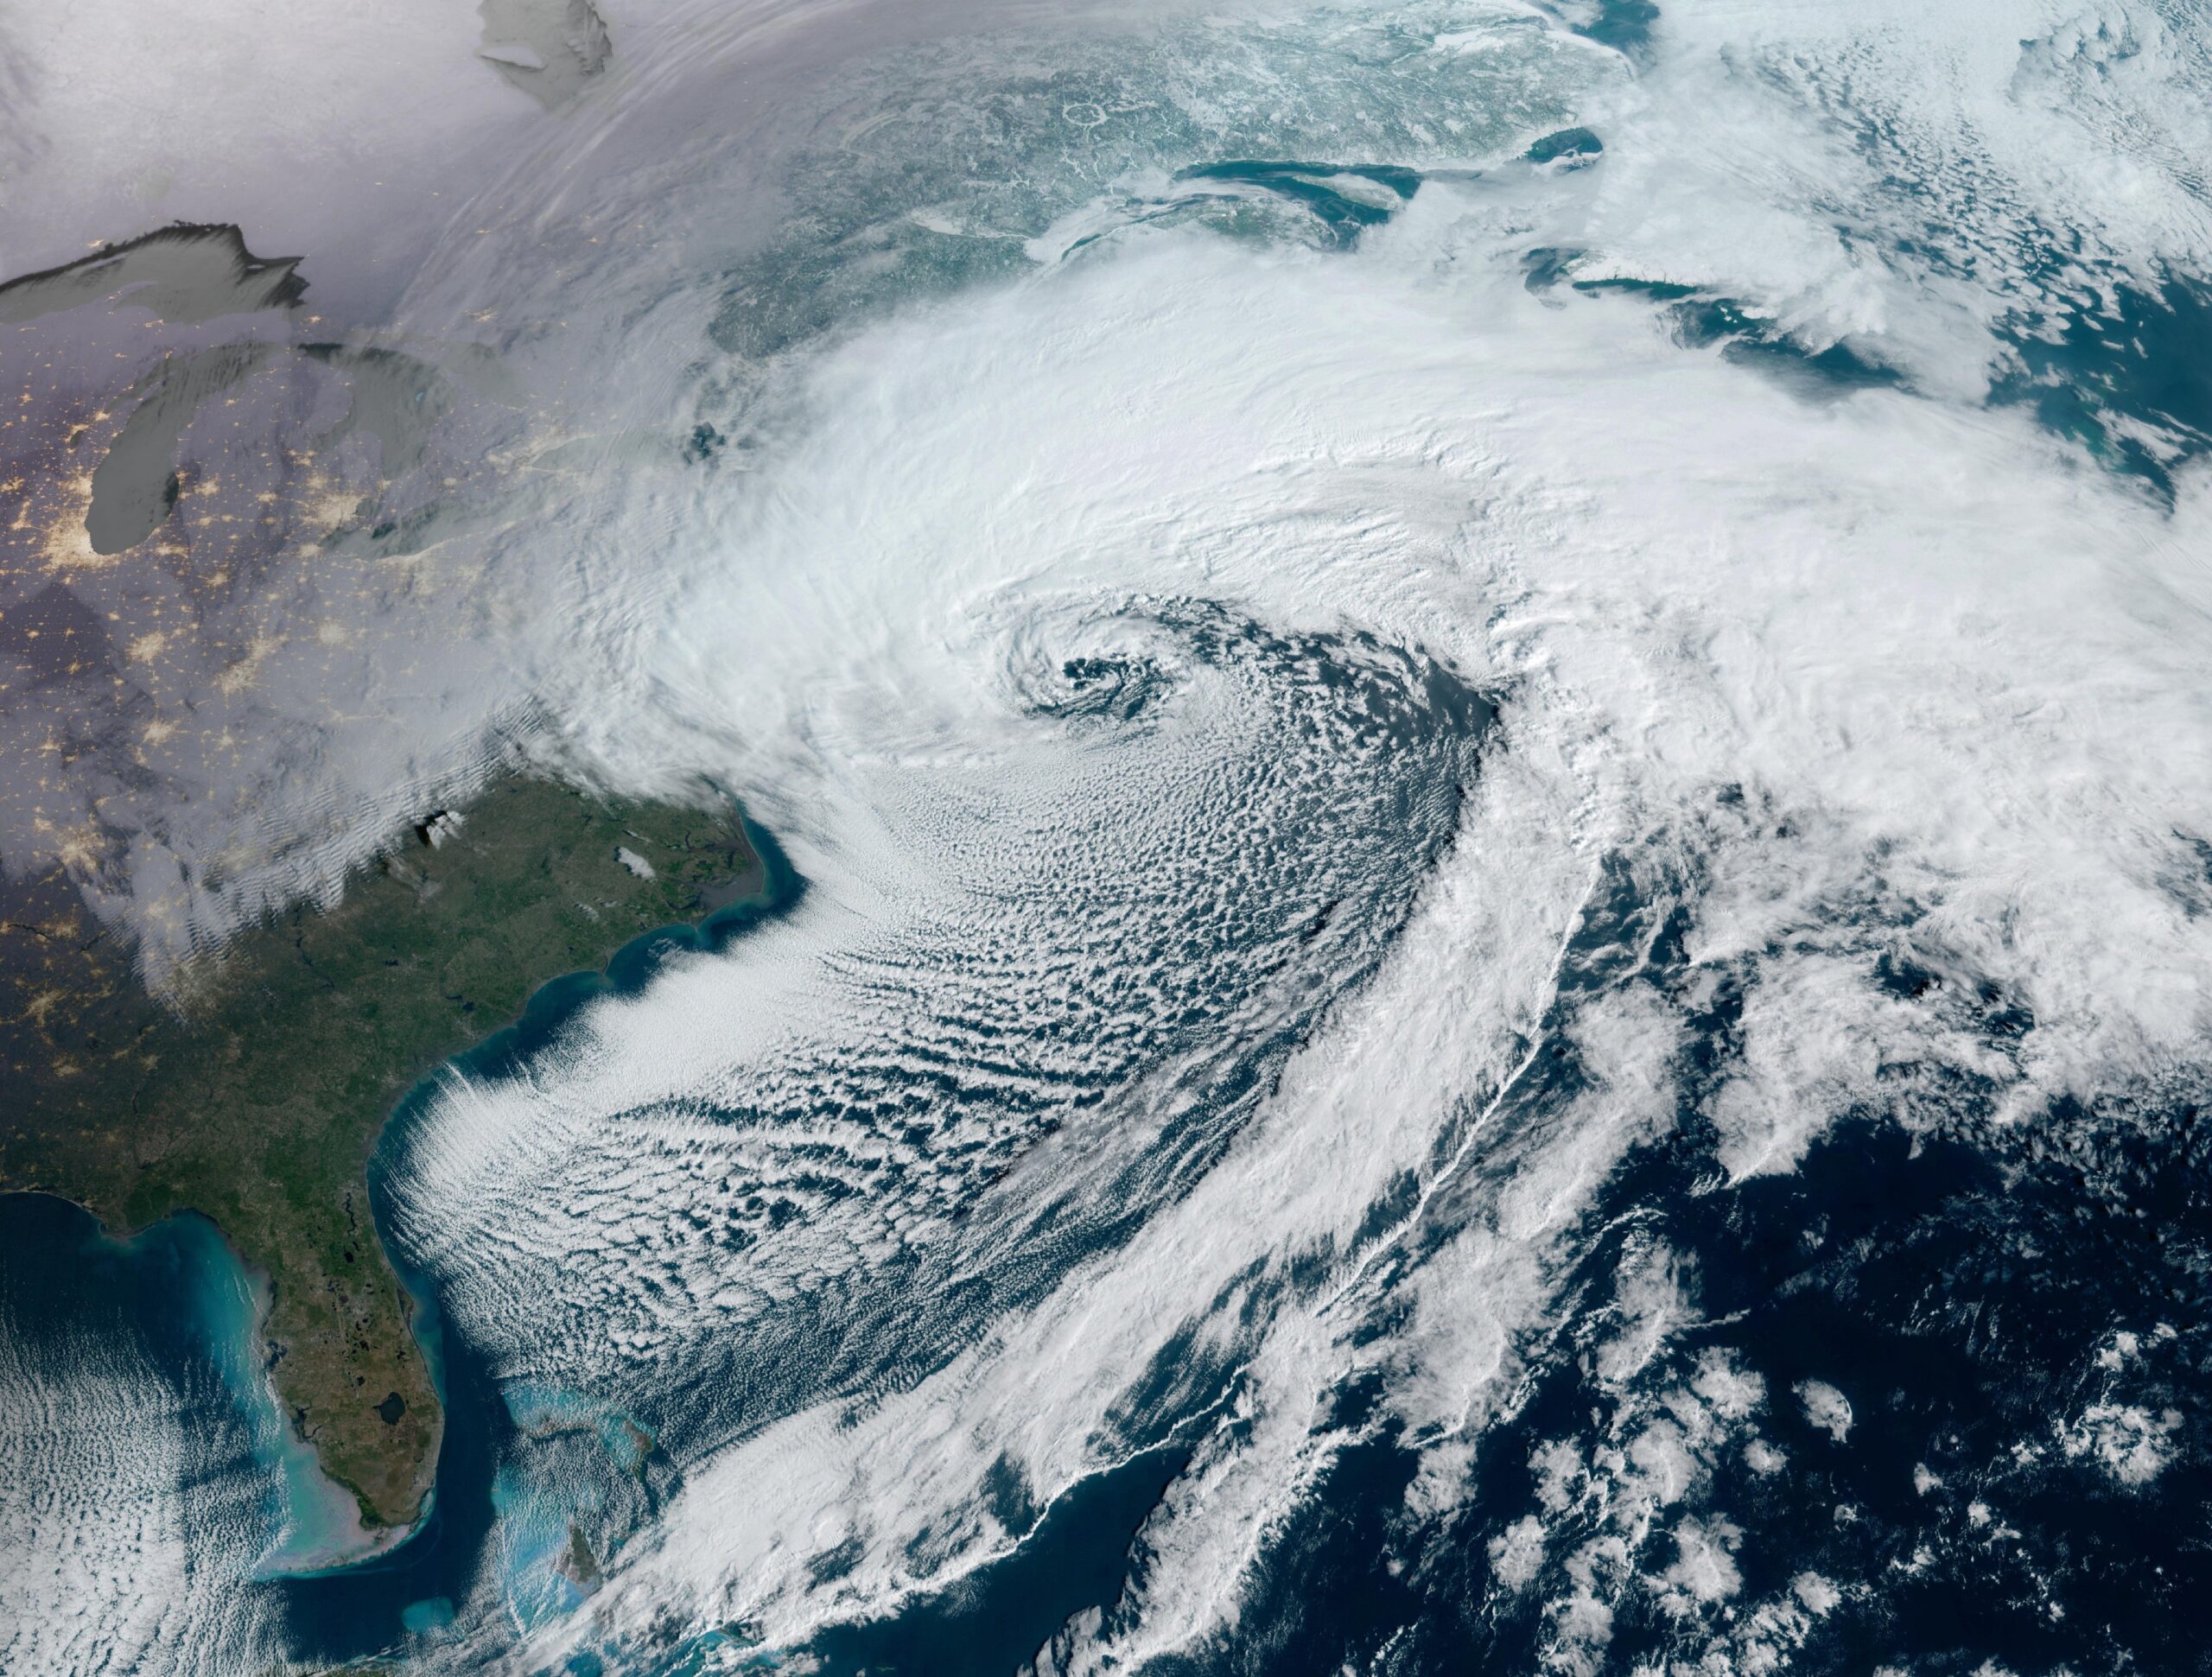
Just as a generational run of snowcover was starting to go away, a fresh nor’easter piled near historic snow amounts onto our lawns, beaches, cars and streets Feb. 22-23.
While nor’easters at the Jersey Shore are feared most for their tidal flooding, it was the snow that was most impactful this time.
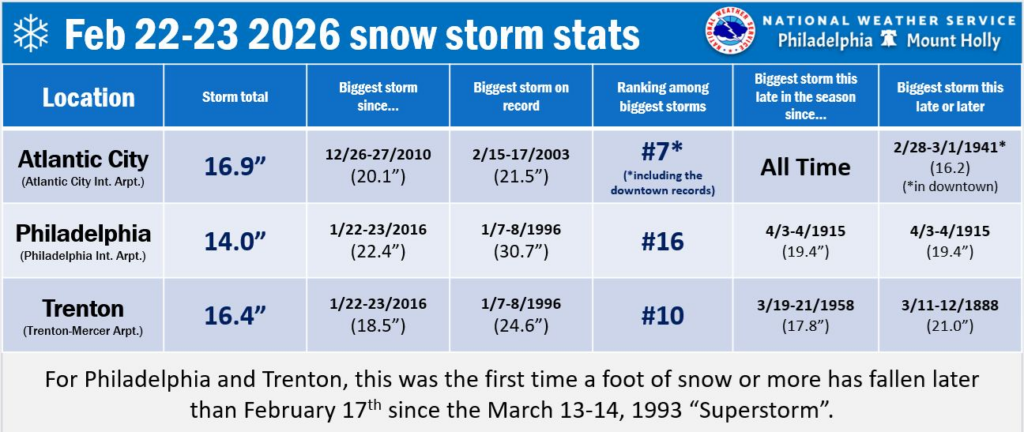
Nearly everywhere at the Jersey Shore had double-digit snow reports. Atlantic City International Airport picked up 16.9 inches of snow over the two-day stretch, according to the National Oceanic and Atmospheric Administration (NOAA). It was the biggest snowstorm this late in the winter season since records began in 1943, and the sixth largest two-day snowfall. Other Jersey Shore totals, measured in inches, included:
Cape May County
Ocean City: 16.0
Lower Twp.: 12.5
North Wildwood: 8.7
Atlantic County
Mays Landing: 19.0
Somers Point: 18.2
Egg Harbor Twp.: 18.0
Minotola: 17.0
Buena Vista Twp.: 16.5
Egg Harbor City: 15.3
Hammonton: 10.7
Ocean County
Jackson: 25.2
Lakewood: 24.0
Toms River: 22.0
Lakehurst: 21.8
Manahawkin: 19.0
Brick: 18.5
Ship Bottom: 18.0
Lanoka Harbor: 17.0
Tuckerton: 17.0
Monmouth County
Marlboro: 26.5
Middletown: 25.0
Freehold Twp.: 25.0
Snow receipts timeeeeeeeee. ❄️🧾❄️🧾
How'd we do at Cup A Joe Weather?
Feeling uncertain? NJ based See You Through It Counseling offers therapy for all ages. Call 856-335-1352. pic.twitter.com/Qy04a5Li7l
Here are seven reasons why this nor’easter will be talked about for years.
It was a bomb cyclone
It wasn’t just a nor’easter; it was a bomb cyclone, as the National Weather Service confirmed after it rapidly intensified through a process known as bombogenesis.
While sources vary, this storm saw a roughly 40 millibar drop in air pressure between Sunday morning and Monday morning. You need at least a 24-millibar drop in air pressure within 24 hours to be a “bomb.” This is the hallmark of a strong nor’easter.
It achieved that and then some.
It ‘generated’ its own cold air
It was mild in the days leading up to the nor’easter. High temperatures on Feb. 20-21 – Friday into Saturday – were in the upper 40s to low 50s. Even Sunday morning, temperatures were 35 to 40 degrees, and it was raining.
Then, as the storm underwent bombogenesis, there was a large amount of upward motion and air expansion. As the air expands, fewer molecules bump into each other, and you get cooling. In other words, it cooled down and rain turned to snow.
Temperatures hung on above freezing, with snow late Sunday afternoon not sticking much to roads and sidewalks. That happened later than I expected.
But once the sun set, temperatures sank below 32 and snow accumulated rapidly.
Light rain fell along the South Jersey Shore on Sunday night and Monday, but that was not often and the northern part of the shore stayed locked in as snow.
A multi-state ‘mega band’ of snow
The 15-inch or greater totals in most of Atlantic County and points north at the coastal counties were helped by heavy snow that fell for hours Monday morning.
The nor’easter generated two large bands of snow. We had the western one, which extended from western Massachusetts to the Hudson Valley and down the Garden State Parkway to Atlantic County.
If you were in it, you had snowfall rates of 1 to 2 inches per hour. It was roughly from around 2 a.m. to 10 a.m. So, if you do the math, that adds up.
While the storm underperformed my forecast Sunday afternoon, it made up for it Monday morning.
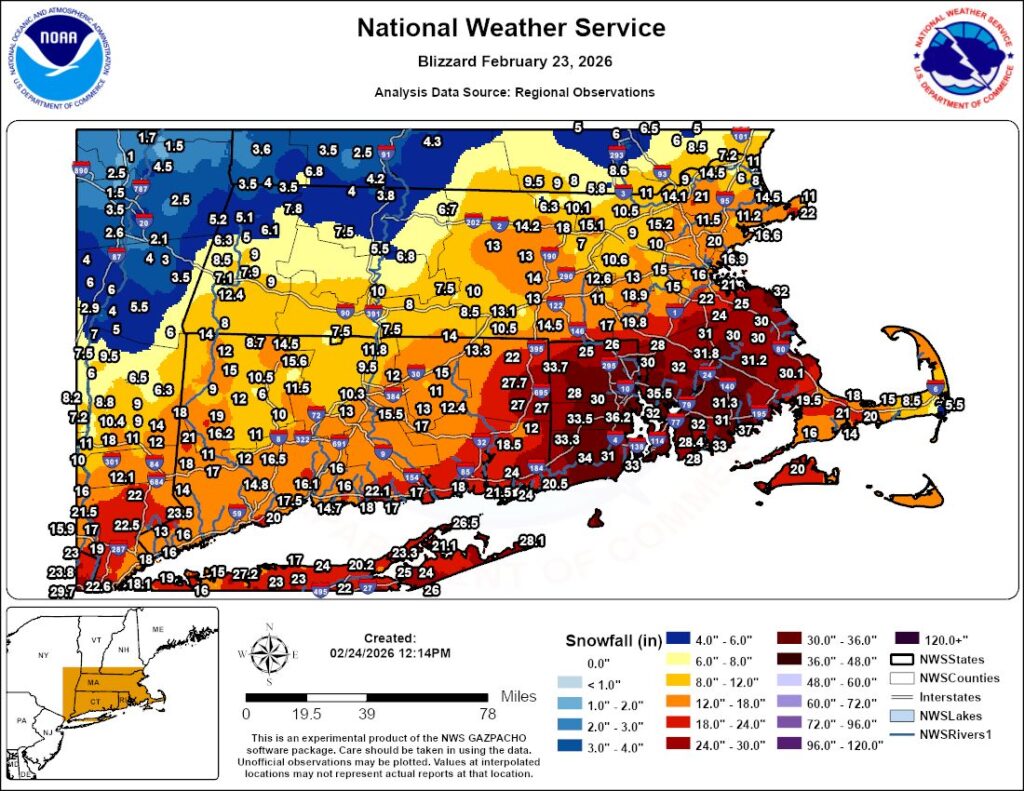
For what it’s worth, the eastern band was responsible for bringing Rhode Island’s largest snowstorm on record – 37.9 inches of snow fell in Providence, according to WPRI-TV and other outlets.
The snow was very wet
Heavy, wet snow piled up feet high in Avalon (courtesy of Avalon Public Works, a ShorelySafe client of our company)
The amount of precipitation that fell during this event ranged from 1.7 to 2.3 inches. We had a lot of snow, but a lot of liquid as well.
In New Jersey on average, 11 inches of snow falls for every inch of liquid. This was lower.
Woodbine likely had 18 inches of snow on 1.97 inches of liquid, according to the Community Collaborative Rain Hail and Snow Network (CoCoRaHS). That’s a snowfall ratio of roughly 9:1.
At Atlantic City International Airport, 16.9 inches of snow occurred with 1.97 inches of liquid. That’s a snow ratio of 8.6:1.
You noticed it. The snow was very hard to shovel or snowblow, and not just because of the amount. The snow stuck to my narrow windshield wipers. If the snow was fluffy, that wouldn’t happen.
Drought concerns eased
The 1.7 to 2.3 inches of liquid brought February’s precipitation back to average. That was much needed and reduced the risk of worsening drought going into wildfire season.
The United States Drought Monitor Feb. 26 update, which includes data through Feb. 24, showed an improvement in drought in parts of Cape May, Atlantic and Monmouth counties. It fact, drought was removed in Upper Cape May County and southern Atlantic County.
Probably the windiest snowstorm in decades
Atlantic City International Airport reported a 61 mph wind gusts at 3:13 a.m. Monday, Feb. 23. The National Weather Service said no major snowstorm or blizzard since 1978 had a gust as high as this one.
Record amount of Sunday winter snow
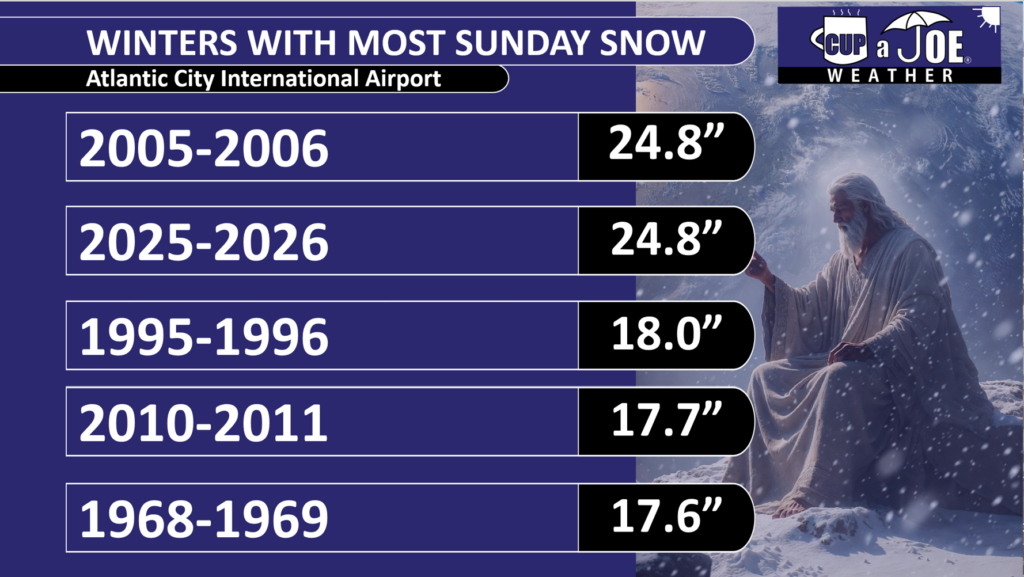
It may have taken divine intervention, but with 6.9 inches of snow at ACY Airport on Feb. 22, this winter is now tied with 2005-2006 for the winter with most Sunday snow on record.
Data via NOAA
With a brutally cold shot of air expected to begin in March, it’s still possible that 2025-2026 could claim the top spot for itself. Who said Sunday was a day of rest?
Thank You
I know you have other options for weather and appreciate that you stick here with Cup A Joe Weather. From Feb. 17-24, we had 2.005 million social impressions, 450,000 video views and a website audience of over 10,000 people.
A big thank you to our advertisers for making this possible. Without them, we can’t cover the shore like no where else.
With temperatures much colder than average around here, the depths of winter have been feeling more like New England than the Jersey Shore.
From Jan. 18 to 31, temperatures at Atlantic City International Airport were what the same typical two-week period would be in Portland, Maine, according to the Southeast Regional Climate Center. From Jan. 25 to 31, the mean temperature at Atlantic City International Airport was just 18.6 degrees. You’d have to travel far north to find similar readings. Anchorage, Alaska, is the closest match. The same is true at the Sen. Frank S. Farley State Marina.
Days of sub-freezing temperatures and nights with sub-zero windchills are certainly bitterly cold. However, you don’t have to look that far back to find Januarys just like it.
Believe it or not, January 2026 was milder than last January at both the airport and the marina, according to the National Oceanic and Atmospheric Administration (NOAA).
At Atlantic City International Airport, the average temperature for January was 30.8 in 2026, compared to 30.6 during the same period in 2025. Both readings fall a little below the mean of 33.0. At the Atlantic City Marina, the average was 32.7 in 2026, up from 32.1 in 2025, but still below the 34.5 mean. Even up the Jersey Shore at Long Branch, Monmouth County, 2025’s January was just 0.7 degrees milder.
In other words, January 2025 was colder. However, I hear you, 2026 just felt more frigid.
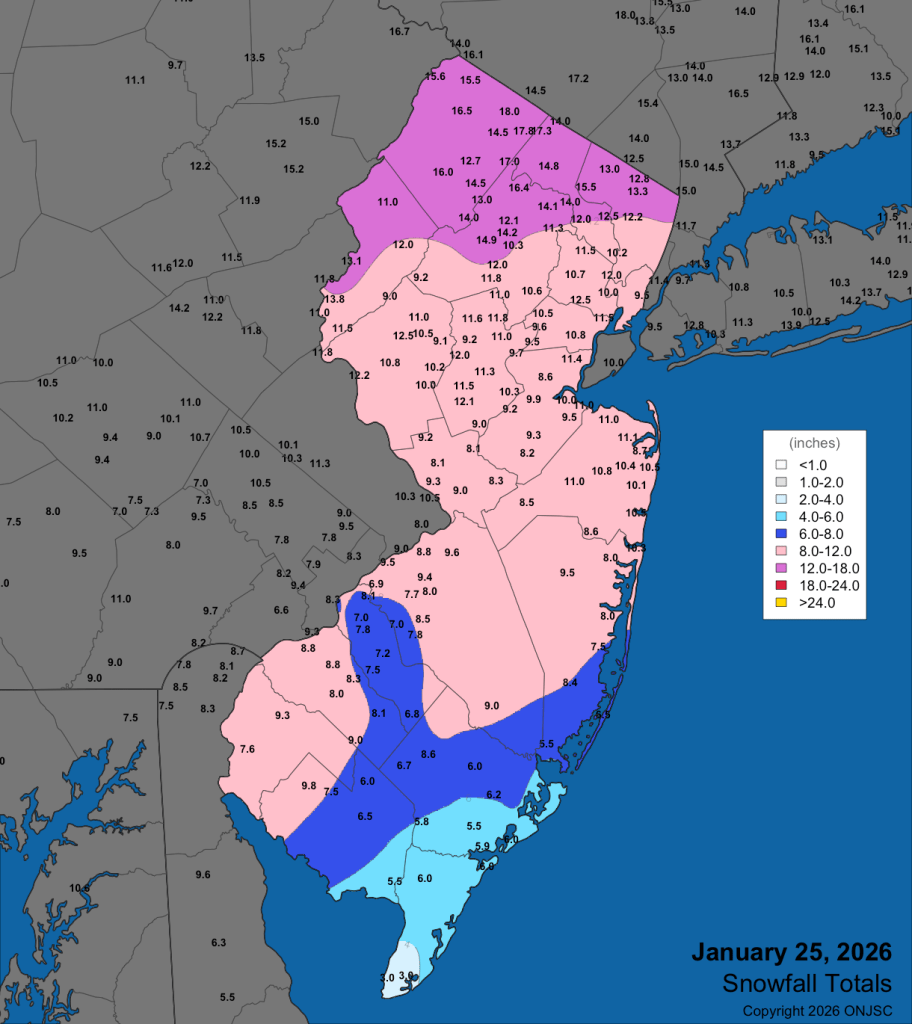
Maybe it’s because of the snow. Last January experienced a South Jersey Snow Special on Jan. 6. Six to 10 inches of snow fell in Lower Cape May County, with a plowable snow south of the Atlantic City Expressway. However, it was gone a week later. Meanwhile, our winter smorgasbord from Jan. 25 to 26 continues to be an icy glacier more than 10 days later.
A snow covered Mid-Atlantic from Feb. 2, 2026 on the visible satellite image. Note the green area in eastern New Jersey. That’s the dense forest of the Pine Barrens. There was still snow on the ground there. (College of DuPage)Snow and sleet totals from the Jan. 25, 2026 Winter Storm (Office of the New Jersey State Climatologist)
Maybe it’s because, compared to average, New Jersey is among the coldest places in the United States this winter, according to Ben Noll of the Washington Post.
Maybe it’s because our coldest days were colder. Five days were 15 or more degrees below average at ACY Airport this year. Last year, there were three. It was nearly the same in Atlantic City.
Otherwise, maybe it’s just because we remember only what happened to us lately. Last January had more days with gusts over 45 mph, according to NOAA, compared to this January.
Bay ice concentration in the Mid-Atlantic last January, at its peak (48.72%), was double what it was at its peak this January on Jan. 29 (20.5%).
Compared to the rest of recorded history, this January was just a little colder than average. In our climate-changing world, it’s been harder to achieve long stretches of bitterly cold temperatures.
Last month, the only cold temperature records that occurred within our four, long-standing Jersey Shore weather stations (Lower Township, Atlantic City International Airport, Atlantic City Marina and Long Branch) were:
Atlantic City Marina tied a record cold maximum temperature of 22 degrees on Jan. 30. Long Branch broke the cold maximum temperature record with 18 degrees on Jan. 31.
That’s not much. New Jersey had the 39th coldest January of 132 years of record keeping, Dave Robinson, the New Jersey state climatologist said on my Monthly Weather Roundup show. The coastal zone, which is generally anywhere east of the Garden State Parkway, was the 41st coldest.
December and January are as cold as the 1960s at Atlantic City Marina. ACY Airport was like an average one in the 1980s.
The climate is changing at a rate not seen since the end of the Paleozoic period 250 million years ago, according to research reported in Science magazine.
Looking ahead, February looks like it will be a colder-than-average month. That would be our first meteorological winter (December-February) colder than the long-term average in quite some time. However, if you’re done with the cold, keep in mind that the days are getting longer and it’s a little light past 6 p.m. now.
The more bitterly cold time of the year is behind us. Warmer days are on the way.
I was going to write this column anyway, but with the 2016 Challenge spreading throughout the internet, this came at a perfect time.
The Blizzard of 2016 happened Jan. 22 to 24 of that year. The Weather Channel named it Winter Storm Jonas, which is how many of us know it today.
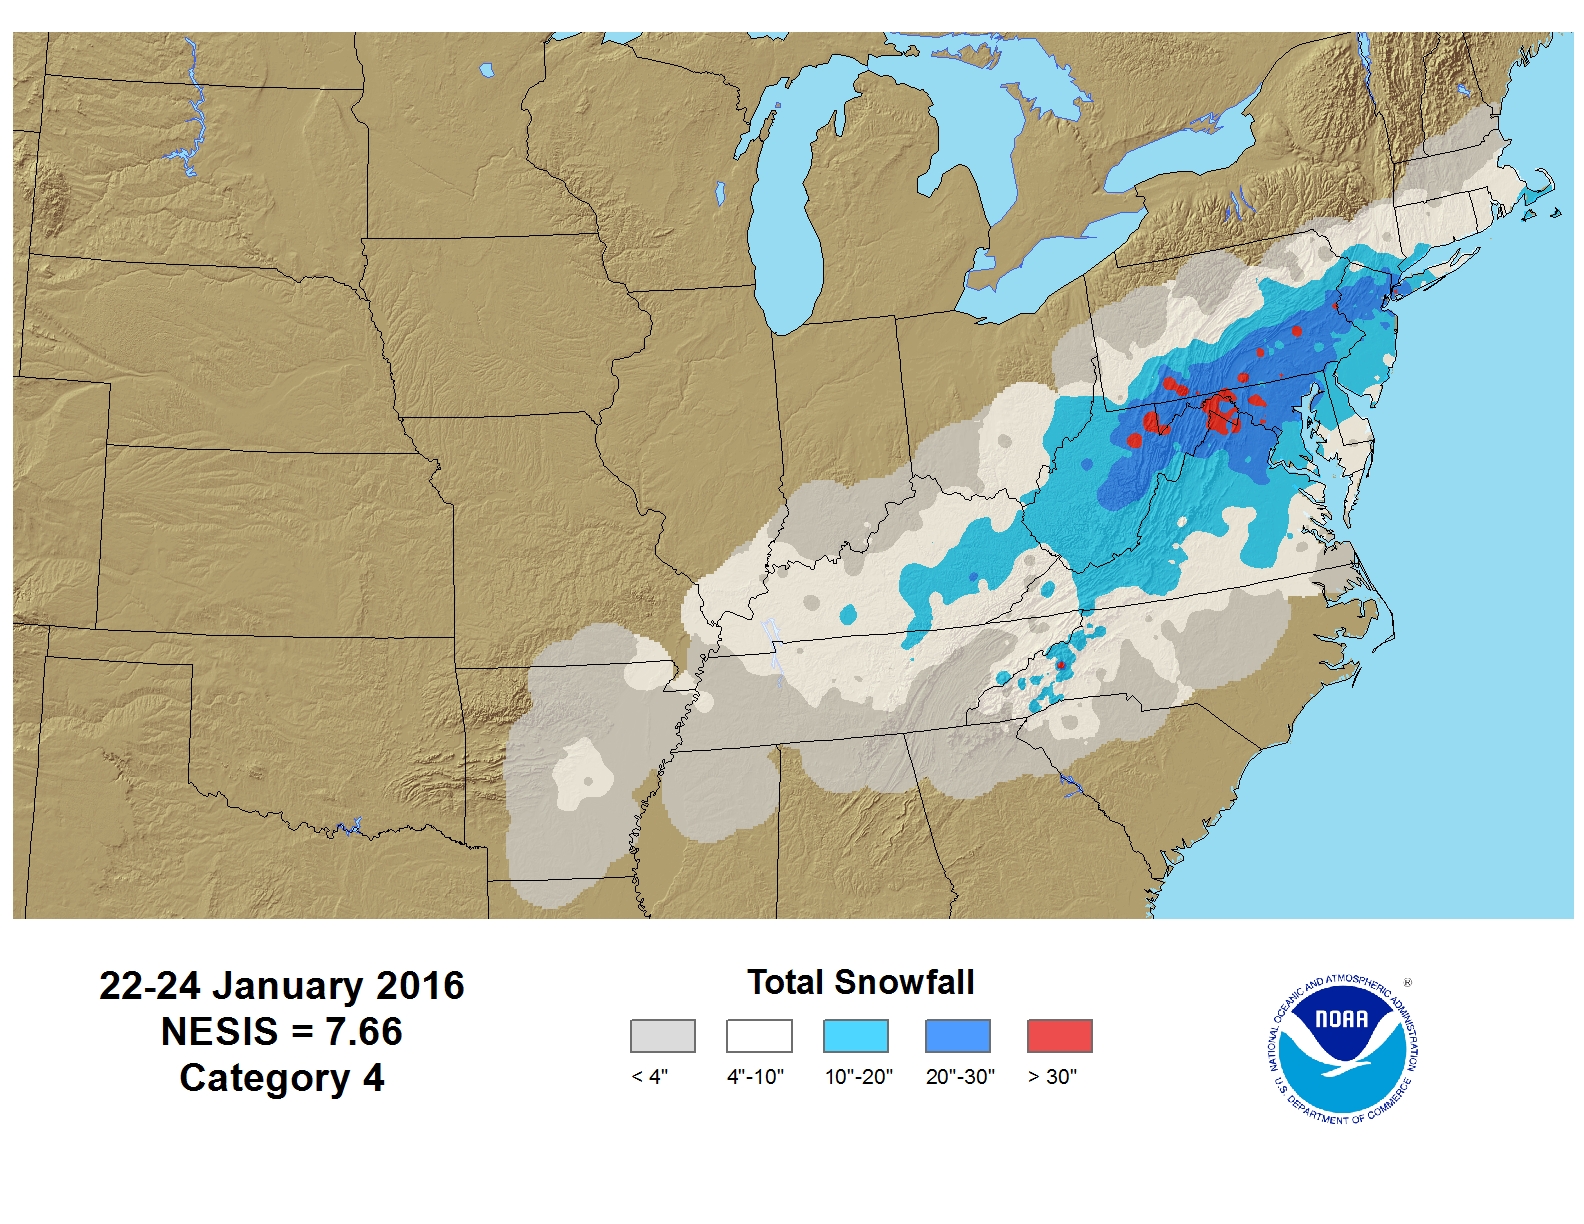
It came with high winds, rounds of significant coastal flooding, extreme cold and, of course, snow. This nor’easter had it all, enough to make this the fifth most impactful northeast winter storm since records began in 1956, according to the National Oceanic and Atmospheric Administration (NOAA). For context, that’s between the slightly weaker Presidents Day II Blizzard of 2003 and the much stronger Blizzard of 1996.
Regional wide snowfall totals from the Blizzard of 2016 (via the National Oceanic and Atmospheric Administration)
Sadly, at least eight people died, according to NJ.com, and over 100,000 homes and businesses were without power. Moody’s Analytics estimated $4 billion in damage on the East Coast, in December 2025 dollars.
Jonas is a good reason why my weather dad, Jim Eberwine, always says that we have a 12-month hurricane season here at the shore. Nor’easters around here are feared more for their flooding and wind than the snow itself.
Flooding rivaling Sandy
For those south of Brigantine, where Superstorm Sandy made landfall four years earlier in 2012, the Blizzard of 2016 brought even more significant flooding.
Two rounds of flooding affected the Jersey Shore the mornings of Jan. 23 and 24. The combination of powerful, onshore winds, and the near-full moon drove feet of saltwater into beach towns in some locations.
In Cape May Harbor, the NOAA tide gauge reached a record 9.36 feet above mean lower low water. That was more than a half foot higher than Sandy. Below are others that had a higher crest than Sandy.
Delaware Bay (Cape May):
8.98 feet in Jonas
8.89 feet in Sandy
North Wildwood:
9.44 feet in Jonas
8.9 feet in Sandy
Nearly every tide gauge, from Cape May to Tuckerton, was in major flood stage on Jan. 23. That made travel nearly impossible around the high tide (snow and ice aside) and brought water into homes and businesses that rarely see it.
Farther north through Sandy Hook saw moderate flooding, similar to the flooding we had during the October 2025 nor’easter. Generally the flood level was 3 to 4 feet above normally high ground along the South Jersey shoreline.
There were concerns about saltwater freezing on the roads on the nights of Jan. 23 and 24, as temperatures fell into the 20s. However, that mostly did not occur.
Whipping winds
Power outages were a problem for many at the Jersey Shore. Onshore winds were fierce and drove tidal flooding.
Strathmere had the highest gusts at the South Jersey Shore, topping out at 64 mph at 6:28 a.m. on Jan. 23, according to the National Weather Service. Several places gusted at or over 60 mph, including Ocean City, Cape May and Pleasantville.
However, the strongest winds were in Ocean County. Good Luck Point in Bayville took the top mark statewide at 72 mph. Good luck standing in that. Other Ocean County gusts on Jan. 23 included:
Tuckerton: 68 mph
Harvey Cedars: 64 mph
Beach Haven: 62 mph
Lakewood: 61 mph
Seaside Heights: 61 mph
Holgate: 61 mph
Beach Haven: 60 mph
Beyond that, many beach towns, from Sea Bright to Cape May, gusted to at least 50 mph once.
A decent amount of snow
The fierce winds blew and snow drifted feet high. However, snow was more of a concern for inland folks rather than people in shore and beach towns.
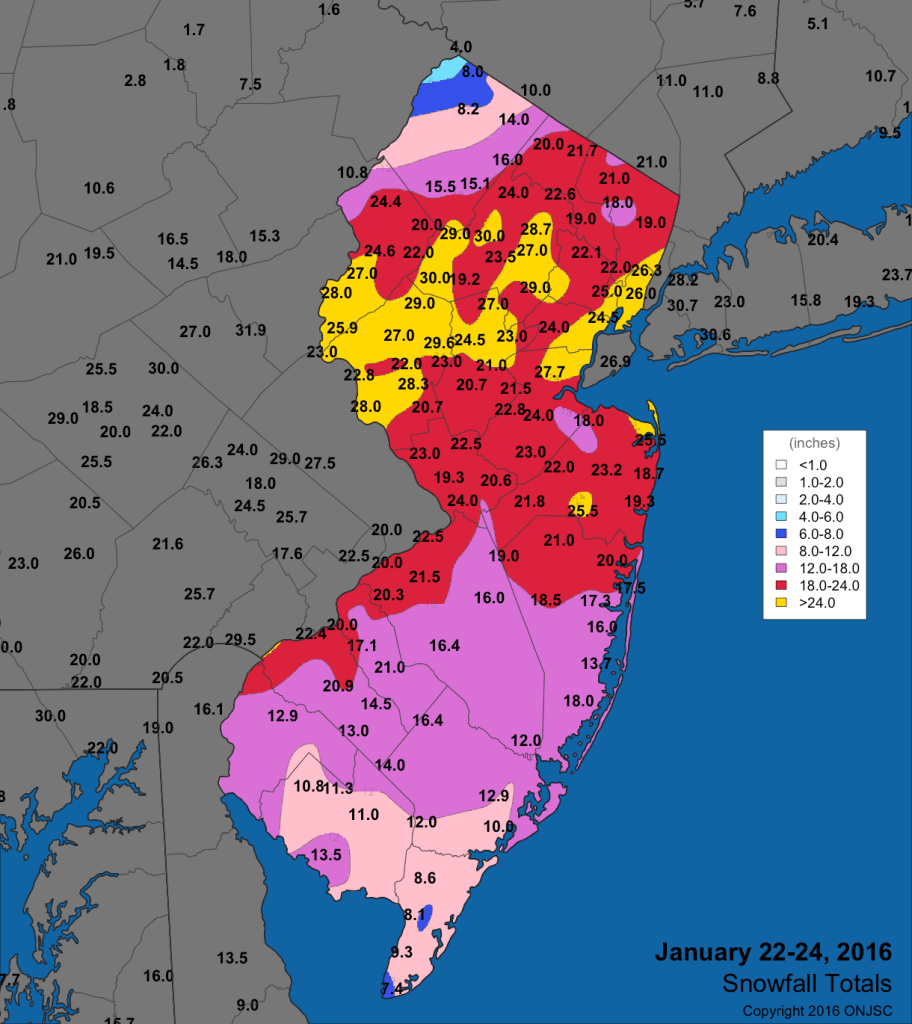
The highest snowfall totals reported in Atlantic and Cape May counties were 17.5 inches in Buena Vista Township. Closer to the coast, Atlantic City International Airport picked up 12.9 inches. Wildwood Crest had 11.3 inches and Woodbine had 8.6 inches, according to data gathered by the Office of the New Jersey State Climatologist.
In typical Jersey Shore fashion, we had a smorgasbord of precipitation types.
“Snow began falling in the south during the early evening of the 22nd, moving steadily northward,” said Dave Robinson, the New Jersey state climatologist at the time.
“The intensity of the storm grew overnight, with heavy snow falling by the morning of the 23rd, winds howling and ocean waters pouring into coastal communities at times of high tide… Early snow turned over into a mix of snow, sleet and rain in… coastal areas, before turning back to snow toward the storm’s end.”
Snowfall totals from the Blizzard of 2016, via the Office of the New Jersey State Climatologist
Farther north, it was a high-end snowstorm. Ocean County picked up 12 to 21 inches of snow. Monmouth County’s lower snowfall total was just 16.5 inches in Colts Neck. Rumson picked up 25.5 inches while on the beach, Long Branch saw up to 21 inches. NOAA’s fifth-place ranking aside, the Jersey Shore hasn’t had a winter storm bring quite the combination of snow, wind and tidal flooding since.
For reference, The Blizzard of January 2022 saw 12 to 21 inches up and down the Jersey Shore. Drifts of snow were all around. Thankfully, there was no tidal flooding.
Just a few weeks before that, there was significant flooding and wind in the snowy nor’easter of Jan. 3, 2022 (I was freezing in my rain boots in a foot of water off the White Horse Pike in Atlantic City). Snowfall totals of 9 to 15 inches buried South Jersey in snow. Once you got to Exit 88 on the Garden State Parkway, barely an inch fell.
Is a big snow expected this winter?
I don’t believe so. As mentioned in our winter outlook column, this looks more like the season for medium-sized snows without major tidal flooding, like the one 1/25 to 1/26 for the Jersey Shore. The prevailing storm track doesn’t favor the types of low-pressure systems that form off the Florida or Georgia Coast, and increase in strength as they move north.
That being said, another bitterly cold outbreak is expected late in January through the first half of February. This may be a case of it being too dry to snow much. We’ll keep you updated.
Joe Martucci, a Certified Broadcast Meteorologist and Digital Meteorologist, is the President and Director of Meteorology for Cup A Joe Weather and Drone. You can connect with him at cupajoe.live/.
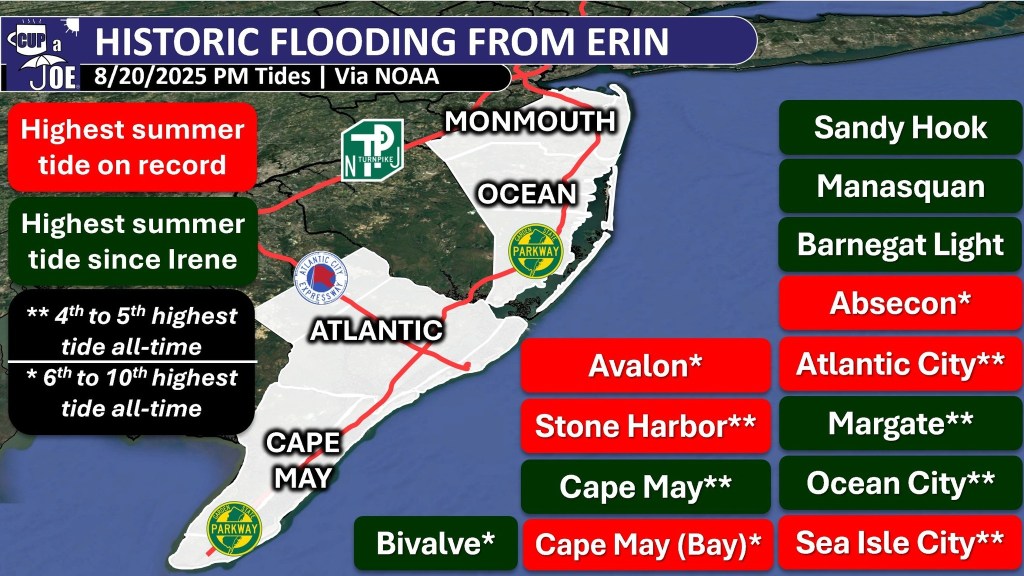
The Jersey Shore had two memorable tidal flooding events in 2025 – August’s Hurricane Erin, and an October nor’easter. New analysis shows that while tidal flooding in 2025 was generally lower than in 2023 and 2024, most of the South Jersey shoreline still flooded more than it had in decades past.
A plethora of smaller storm systems and astronomical high tide cycles also brought minor, or nuisance flooding. Despite the intensity of the flooding, the amount of coastal flooding events in 2025 saw a split, familiar to many, between North and South Jersey (I will not get into the merits of Central Jersey in this column).
Ship Bottom, 35 floods in 2025. Long-term average of 28.
Margate, 49 floods in 2025. Long-term average of 35.
Ocean City, 34 floods in 2025. Long-term average of 31.
This marks at least the third year in a row with the number of coastal flooding events above the long-term average. That average, mind you, is increasing as the number of yearly events increases.
So, why are we seeing an uptick in coastal flooding events in South Jersey?
Sea level rise is a great start and is one of the key coastal flooding components. Between 1911 to 2019, New Jersey’s sea level rose at more than twice the world’s rate – and 40% of it is directly due to man-made, greenhouse gas climate change, according to the Rutgers Scientific and Technical Advisory Panel.
Sea level rise caused for the globe and New Jersey (via Rutgers Scientific and Technical Advisory Panel)
This is primarily because water expands as it gets warmer, along with glacier melt. However, this rise in sea level cannot be entirely blamed on human-caused climate change. There are other unique factors that contribute to our rapid rise in sea level compared to the rest of the world.
Most of South Jersey’s beaches are on barrier islands, surrounded by the back bays and the Atlantic Ocean. In addition, a lack of topography makes it easier for water from both sides (the ocean and the bay) to come into the streets where towns do not already protect the coastline.
With or without a storm, many of these communities experience some degree of coastal flooding monthly during astronomical high tide cycles. Given that, any storm system traveling along or up the coast will only worsen flooding, especially during high tide. Thus, barrier island beaches are the biggest victims of coastal flooding.
This depletion of water from the aquifer has caused the ground above it to sink. As a result, decreasing elevation levels are magnifying sea-level rise, making the Jersey Shore more susceptible to coastal flooding.
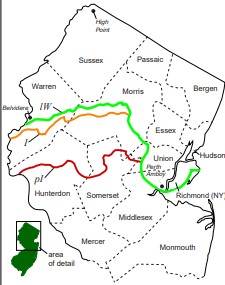
Furthermore, there’s glacial rebound. From roughly 25,000 to 18,000 years ago, a glacier went as far south as present-day Raritan River in North Jersey. The glacier is long gone, however the land is still shifting around from that glacier retreat. That’s also elevating sea levels.
Southward extent of NJ glaciers from 25,000 to 18,000 years ago.
The opposite is true for the northern Jersey Shore beaches. From Sandy Hook to Ship Bottom, tidal flooding was lower than average. Regardless, coastal flooding still brought its fair share of impacts to some of Monmouth and Ocean counties’ most vulnerable spots.
Year-to-year fluctuations in the number of coastal flooding events are to be expected at specific shore locations. Yet, looking at the Jersey Shore as a whole, one cannot deny the upward trend in coastal flooding events, and the reasons behind them.
As for this year, there has been no tidal flooding yet. Let’s hope it stays that way for a while.
I can’t forecast the Jersey Shore weather 365 days out, but given a full year of a new president, and the recent election of a new governor, expect behind-the-scenes, policy-side changes when it comes to meteorology.
Overall, 2025 was a pretty quiet year for big weather and climate events at the Jersey Shore. We need to keep it that way. Here’s what to keep an eye out for in the year ahead.
How bad will the drought get?
It’s No. 1 on my list of top 10 weather events of 2025, and we’ll carry this over into our lookahead column for 2026.
The fifth wettest May on record going back to 1895, according to the New Jersey State Climatologist, pulled New Jersey out of the most significant drought since 1999-2002.
However, it was brief. Summer was dry and on Dec. 5, the New Jersey Department of Environmental Protection returned the state to Drought Warning status. That brought voluntary water conservation.
The United States Drought Monitor has the Lower Cape, the Delaware Bayshore and essentially the western half of the state in one of the four drought stages. A dry January may be good for your health, but it will hurt the heartbeat of New Jersey’s nature.
The Climate Prediction Center gives “equal chances” for either a wetter or drier rest of the winter. Hopefully, it will get wetter. If it doesn’t, expect an active forest fire season. Don’t be surprised if the state issues its first Drought Emergency, with mandatory water restrictions by the governor.
Will NJ REAL laws pass?
Speaking of governor, New Jersey will have a new one in 2026. Mikie Sherill takes the top spot in New Jersey government on Jan. 20. Also in January is the “anticipated adoption” of the Resilient Environments and Landscapes (REAL) rules to change environmental land use regulations by the New Jersey Department of Environmental Protection.
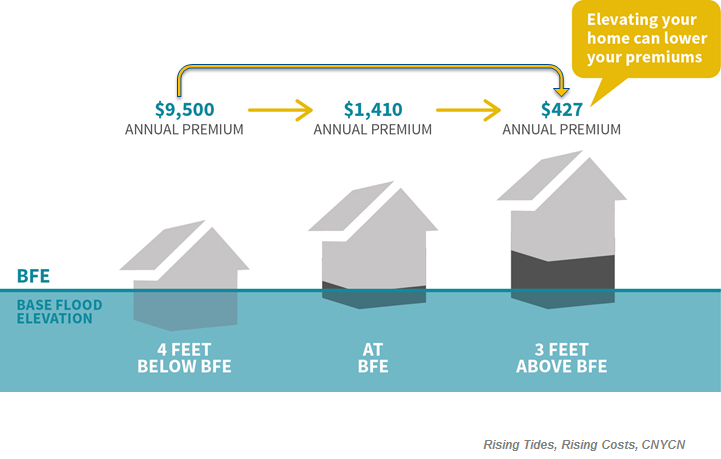
The NJ REAL rules will mandate a variety of changes. Most notably for the shore, however, would adjust the Base Flood Elevation (BFE) level upward. That’s the height floodwaters are expected to reach with a 1% chance in any given year. If you live in a flood zone with a federally backed mortgage, your lowest floor must be at or above the BFE.
BFE stands for Base Flood Elevation. In 2026, BFE could increase in New Jersey, raising the height homes with federally backed mortgages would have to be.
Right now, the state requires structures in flood zones to be one foot higher than BFE. The NJDEP first proposed this to go up to five feet above BFE, based on a 17% chance sea levels will rise that amount by 2100. However, after public feedback, it was revised to four feet.
The current DEP commissioner is Shawn LaTourette, who’s served since 2021. At the time of this writing (Jan. 8), Gov.-Elect Sherill had not announced whom the DEP commissioner will be.
If she keeps LaTourette, expect new homes at the Jersey Shore to go higher to protect against flooding. If a different commissioner comes in, you may see a quick change, or removal, of the NJ REAL rules.
NOAA helps keep people safe in the United States by providing daily weather forecasts, warnings of dangerous storms and information about long-term climate changes through its National Weather Service.
Since then, some jobs have come back. NOAA is hiring again. President Donald Trump and the Senate also tapped Dr. Neil Jacobs to be administrator. He held the “acting” role from 2019-2021.
One of the major changes in the new year is that the National Weather Service, which is under NOAA, can hire for positions directly. This allows our local office in Mount Holly, for example, to act quickly to fill vacancies.
Can AI weather models progress more?
Speaking of the United States Government, NOAA took a big leap forward at the end of 2025 with the announcement of three new artificial intelligence weather models.
The AI models are different. They take the current and recent state of the atmosphere, but they look for similar patterns in the weather that have happened before, with some physics. It then uses what happened in the past as a basis for what will happen in the future.
American, European and Google weather computer models have been better over their traditional physics-based counterparts. A downside has been the resolution of the forecast is lower than the physics-based models. If we can improve that in 2026, the old way of computer model forecasting will probably be out.
Changes at the National Hurricane Center
Each year, the NOAA’s National Hurricane Center, based in Miami, Fla., releases a list of updates and changes to the way they conduct business. Last year brought six changes. This always involves updating the size of the forecast track cone, which shows an area with a 66% chance of the storm’s eye to be in.
We’ve seen drastic improvements in the size of the forecast cone over time, allowing emergency managers, mayors, police, fire and meteorologists to tell you more accurately if you’ll be in harm’s way or not. Expect to see another slight improvement this year.
Easier to understand National Weather Service forecast discussions
The National Weather Service in Mount Holly, our local office, is hoping you will read more of their forecast reasonings this year.
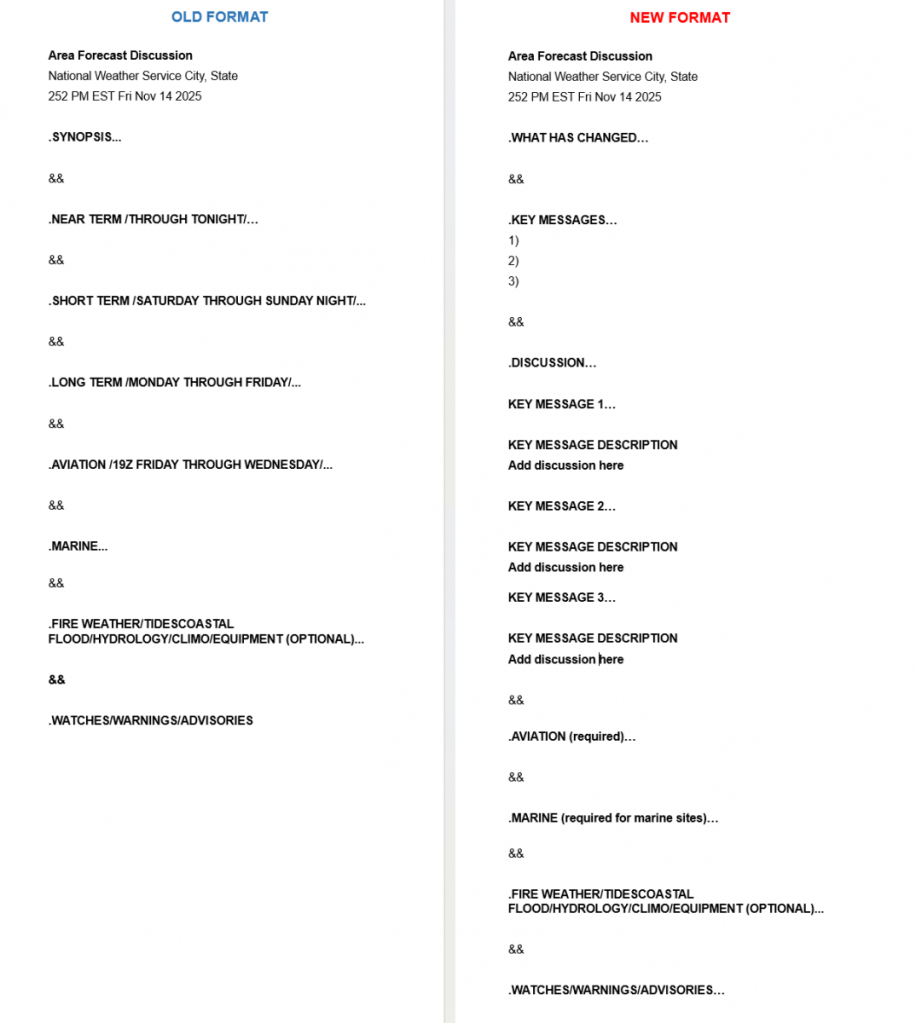
The “Area Forecast Discussion,” the NWS office’s way of explaining why the forecast will be the way they predict, switches from chronological order to severe impact order. If a nor’easter is hitting five days from now, that will be talked about first, not the forecast for tonight.
They will also include a “What Has Changed” section. This is an easier way to see their updates than before.
This change began on Jan. 6. So, you can see it now by going to www.weather.gov/phi and clicking on the “forecast discussion” link.
Soon, you’ll get a better-looking radar loop, which shows blue for snow, green for rain and is labeled with towns. You’ll also have more Jersey Shore local weather in the main player with automated, up-to-the-minute conditions. Plus, we’re looking to add webcams to the feed. So, if you have a webcam you’d like to share with us for the channel, reach out!
Also absent is yearly warmth. For the first time since 2014, the Jersey Shore will fall outside of the top 20 for hottest years since reliable records began in 1895, according to Dave Robinson, the New Jersey State Climatologist, while also my “weather dad” and May 13 birthday buddy.
However, a stretch of extremely hot days did make the top 10, so did muggy weather, severe weather, frigid weather, nor’easters, tropical systems, among other things.
Note that the data below is from the National Oceanic and Atmospheric Administration, unless written otherwise.
Let’s get into it.
10) Fortescue’s stifling high dew point on July 25
Fortescue juts out into the Delaware Bay in Cumberland County, allowing the sometimes very warm water to come onto the marshy land. Bay waters in the 80s paired with a very sultry wind from the Deep South brought the dew point to an astounding 88 degrees at 4 and 5 p.m. that day. That makes for extremely uncomfortable heat indices:
2 p.m.: 106 degrees
3 p.m.: 112 degrees
4 p.m.: 121 degrees
5 p.m.: 118 degrees
6 p.m.: 120 degrees
7 p.m.: 118 degrees
8 p.m.: 109 degrees,
9 p.m.: 97 degrees.
A heat index of 109 degrees at 8 p.m. here is rare. A 121-degree heat index maybe happens three times a year in New Jersey, and it’s only for one town.
Most places in New Jersey never experienced a dew point that high in their record. So, while this only happened in one small community, its impact is might enough to be number 10.
9) Severe heat to severe weather on July 25
Inland high temperatures were as high as 100 degrees (Toms River) with everyone else in the mid to upper 90s. Couple that with high dew points and it was sweltering in the sun.
As is often the case, though, big-time heat means big time thunderstorms.
During the evening, a cold front pushed in from the northwest. The result was a line of thunderstorms that brought many downed trees and powerlines to Ocean and Monmouth counties. Beach Haven, in Long Beach Island had a waterspout. Further north, Seaside Park registered a wind gust of 66 mph.
8) White Christmas drought continues
For the fifteenth year in a row, most of the Jersey Shore went without a White Christmas, the longest on record. Officially, a definition of a White Christmas is at least one inch or snow on the ground Christmas morning. Here were the last White Christmases, by location.
Atlantic City International Airport: 2009
Long Branch, Monmouth County: 2009
Lower Township, Cape May County: 2000
Well inland parts of the northern coastal counties did have a White Christmas in 2024 but for most of our area, it’s been a while. Sorry, Santa.
7) Impressive late winter cold
February 18-20 was the latest three-day streak of sub-freezing temperatures in decades.
At Atlantic City International Airport, Sen. Frank S. Farley State Marina in Atlantic City and Lower Township, the last time this happened this late or later in winter was in 1993.
ACY airport and Long Branch were below 30 degrees all three days. That hasn’t happened since 1980, at the very end of February and beginning of March.
6) June 21-25 Heat Wave
We just went from one of the latest cold snaps on record to one of the earliest streaks of 100-degree heat.
At Atlantic City International Airport, the temperature hit a hot 102 degrees on two days in a row, June 24 and June 25. The last time the airport had two days in a row reaching 100 degrees or higher was during the big heat wave in July 2011. These 100-degree days were the third earliest on record. When looking only at days that reached 102 degrees, they were the second earliest.
Of course, those two days broke the daily records for June 24 and 25. The airport also set a daily record on June 23 with 98 degrees.
Even the beaches felt the heat. At the Atlantic City Marina, June 23 was the first day of 90 degrees since 2022, reaching 93 degrees and breaking a daily record. Two days later, it tied another record high at 95 degrees.
During the six-day heat wave from June 21 to 26, both the airport and the marina set records for the warmest low temperatures at night.
5) October 12-13 Nor’easter
This is the first of two big tidal flooding events of the year.
Powerful onshore winds stacked the bays, bringing flooding conditions to five consecutive high tides. In the back bays, the constant onshore wind prevented the salt water from fully draining out before the next high tide.
Waretown, Ocean County, reported its highest tide on record. That being said, records only go back to 2018. Several gauges reported top 10 tidal heights since at least the year 2000. Numerous roads were closed due to tidal flooding and places that do not usually have tidal flooding did.
The most northern Jersey Shore town, Sea Bright, had 18 occupants removed from 12 flooded vehicles on Ocean Avenue, the only main road in town.
Atlantic City, Harvey Cedars, Little Egg Harbor and Seaside Heights had gusts over 50 mph on both Oct. 12 and 13. Sea Girt gusted to 51 mph on Oct. 13. Even Oct. 13 gusted over 40 mph in a few beach towns.
Bad hair days and frigid faces were common all winter long. January 2025 had 16 days with gusts over 40 mph somewhere within the New Jersey Weather Network stations, run by Robinson and the state climate office. That was a record high for the network
The winter also was the most or was tied for the greatest number of wind advisory for 46-57 mph wind gusts for Atlantic and Cape May counties since we started keeping track in 2006.
A few days were extremely windy.
Feb. 16-17: ACY Airport had the second highest wintertime gust on record, since 1943. It clocked in at 71 mph. Most shore counties gusted over 45 mph. Over 200,000 thousand people were without power throughout the state.
People have asked me for years if it’s been windier at the Jersey Shore in recent years. While it’s a hard sell after this winter, the answer is still no, it’s not gotten windier.
Thankfully, no deaths from the high surf and rip currents occurred.
While many of us typically associate hurricane season in New Jersey in September and October, this was a good reminder that hurricane season runs during our busiest time of the year at the coast, the summer.
2) The April Jones Road Fire
Via NJ Forest Fire Service
The Jones Road Fire, which was first spotted at 9:45 a.m. on April 22, was the fourteenth largest fire in the state’s period of record. It swallowed up 23 square miles in Ocean County, or a little over 15,000 acres, according to the NJDEP.
It started on April 22, 2025, from a bonfire that two teenagers did not put out all the way. Dry weather, strong winds, and low humidity helped the fire spread quickly.
Thousands of people had to leave their homes for safety, the Garden State Parkway closed, and smoke made the air bad even in New York City.
One commercial building and some outbuildings were destroyed, but no homes were lost and no one was hurt. Firefighters worked hard and stopped the fire completely on May 12, 2025.
From Jan. 1 to April 25, 662 wildfires occurred in New Jersey.
Last year through April 25, about half as many wildfires occurred.
The difference was drought. When the Jones Road Fire began, that area was in a transitionary state between drought and no drought, known as abnormally dry conditions, according to the United States Drought Monitor.
1) Drought
The Jones Road Fire was caused, in part by the drought. The first four months of 2025 continued the significant drought that ramped up severely during the driest Fall on record in 2024.
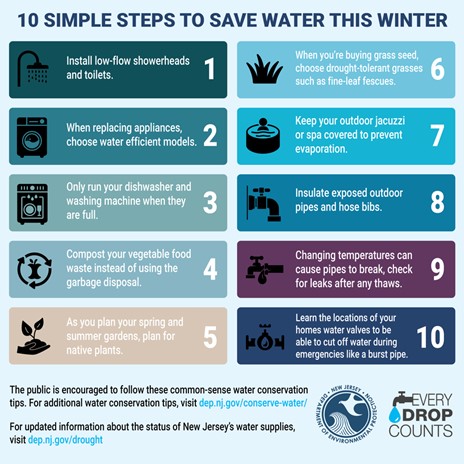
Voluntary water restrictions were in place. New Jersey American Water urged customers to reduce water usage.
Via NJ Department of Environmental Protection
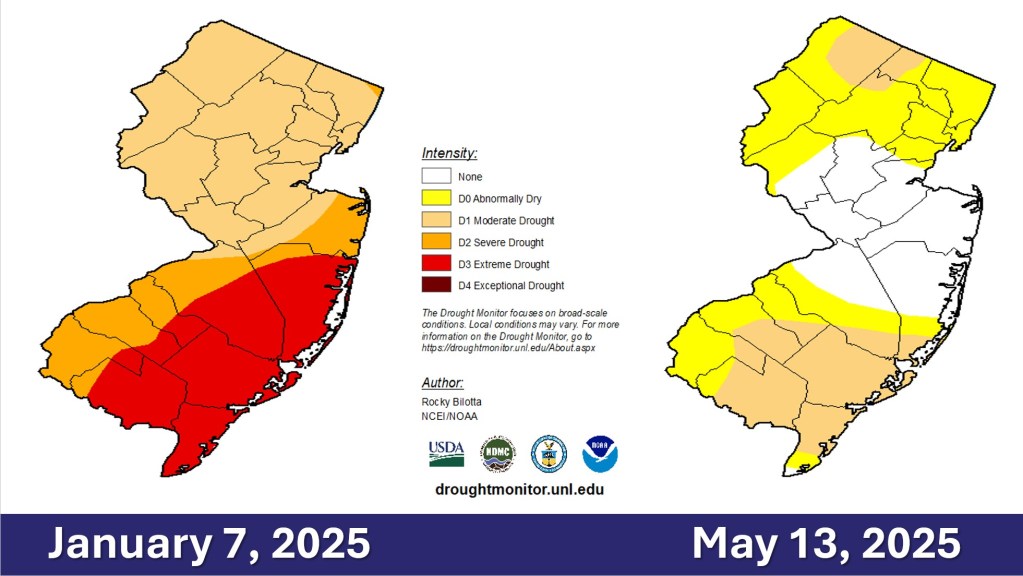
The United States Drought Monitor had at least part of the Jersey Shore in one of the four stages of drought until May 20. An ‘extreme drought,’ the second highest level of drought gripped Ocean County south to Cape May until early March.
Via the United States Drought Monitor
Groundwater from the Kirkwood-Cohansey aquifer in the southern half of the shore counties was ‘extremely dry” through May. Streamflows at the Jersey Shore were ‘extremely dry’ for 32 weeks in a row to start off the year.
The NJDEP continued the Drought Warning in the state on June 11. Even then, Cape May, Atlantic and most of Ocean counties were downgraded just to a Drought Watch, instead of normal conditions like the rest of the state.
The fifth wettest May on record dating back to 1895 busted the drought. However, it was only temporary.
A Drought Warning returned to the state on Dec. 5. Voluntary water restrictions are in place. Extremely dry streamflows and groundwaters returned during the Fall for most of the Jersey Shore. Most of Cape May County joins the western half of the state in drought according to the United States Drought Monitor.
More than likely, December will wind up drier than average across the coastal counties. That puts a lot of pressure on January and February to have more precipitation than average.
If not, more fires like the Jones Road one threatens going into Spring.
Finally…
Dave Robinson, the state climatologist, and I will compare our top weather events of the year during our Monthly Weather Roundup. Look for that on the Cup A Joe Weather and Drone website as well as social media channels on Dec. 30.
He put the October nor’easter above Hurricane Erin, but our number one and two events are the same. What do you think of the list? Leave me a note.
Have a fun, safe New Year. Looking forward to sharing more with you on Shore Local in 2026.
Following in the footsteps of the European weather community, Google, and others, the National Oceanic and Atmospheric Administration (NOAA) has entered the artificial intelligence weather forecast model arms race, and it may have done enough to become the leader.
The government agency, responsible for the National Weather Service and the authority for weather alerts in this country, released three different AI models in a press release on Dec. 17.
“NOAA’s strategic application of AI is a significant leap forward in American weather model innovation,” said Neil Jacobs, NOAA administrator. “These AI models reflect a new paradigm for NOAA in providing improved accuracy for large-scale weather and tropical tracks, and faster delivery of forecast products to meteorologists and the public at a lower cost through drastically reduced computational expenses.”
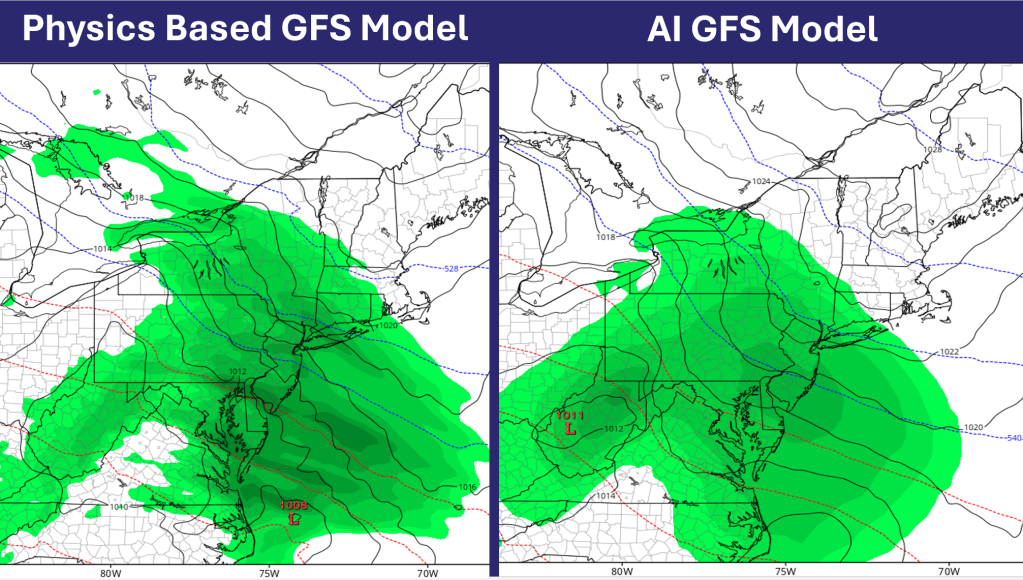
Until now, if I wanted to use an American weather forecast model that is publicly accessible, I would use a physics-based model like the Global Forecast System, or the High-Resolution Rapid Refresh model. In short, it takes the current and recent state of the atmosphere, and runs it into a long math equation. The solution is generated and then we turn it into pretty graphics.
The AI models are different. They also take the current and recent state of the atmosphere, but they look for similar patterns in the weather that have happened before, with some physics. It then uses what happened in the past as a basis for what will happen in the future.
The European computer models, Google, etc., have all created deterministic models, which give the highest likelihood scenario, as well as an ensemble forecast, which gives a range of reasonable scenarios.
However, this new announcement from the United States government puts an important twist on these, one that may well put the U.S. in first place for the best forecasts. The United States just launched a new weather forecasting system called the Hybrid Global Ensemble Forecast System, or HGEFS for short.
The coolest part is how it works. It mixes two different kinds of forecasts to make one super-strong one. It takes predictions for a new AI ensemble model (AIGEFS), and combines them with predictions from the older, traditional physics-based model (AIGFS). Together, they aggregate a huge, 62-simulation “super team” of forecasts.
According to NOAA, this new HGEFS beats both the traditional system (called GEFS), and the pure AI system (AIGEFS) in almost every important test of accuracy.
“As far as we know, NOAA is the first weather organization in the world to run a system like this that blends regular, physics-based forecasts with AI ones,” according to NOAA.
Free computer weather model websites like TropicalTidbits.com or PivotalWeather.com (which you see in my weather videos) have these on their websites, free to view.
Now, to be fair, artificial intelligence has always existed in computer weather models, just a more primitive form.
Those physics-based models, like the GFS, used machine learning – a form of AI – to support the physics equations on the supercomputers. The AIGFS, and the other NOAA models, launched the use of “deep learning” to lead the way.
Secondly, the AI models – not just with NOAA, but with the Europeans – have less resolution than their physics-based counterparts. For example, the physics-based GFS starts with finer detail (about 13 km early on), which helps with local features like storms.
The AI version of the American GFS computer model has benefits, but still forecasts for the globe at a lower resolution than the physics based GFS computer model (via TropicalTidbits.com)
The AIGFS sticks to 28 km globally, coarser than GFS’s best. The AIGFS only forecasts out in six-hour intervals whereas the GFS does so at three-hour intervals for the first 10 days.
Still, when matching up the new wave of AI models to the old ones, there’s a lot of promise to make your Jersey Shore forecast even more accurate.
For example, adding the new AI-based forecast to the mix lets us make reliable predictions a full day further into the future than we could with the traditional physics-based models alone.
For meteorologists and weather weenies alike, these AI models will come out more often. The physics-based GFS runs four times a day. This can run more than 24 times a day, giving us that critical data more quickly.
Finally, these forecasts mean little if they’re not in the hands of a degreed meteorologist. This AI computer model news from NOAA gives us an ever sharper, easy-to-access tool in our toolbox. However, we are the ones who fit the data into your local forecast and communicate clearly to you what it means.
Joe Martucci, a Certified Broadcast Meteorologist and Digital Meteorologist, is the President and Director of Meteorology for Cup A Joe Weather and Drone. You can connect with him at cupajoe.live/.
The Climate Prediction Centerhttps://www.cpc.ncep.noaa.gov/, part of the National Oceanic and Atmospheric Administration (NOAA) is leaning toward above average temperatures for the days around Dec. 25. It’s not just here either. The center is leaning toward most of the Lower 48 being milder than average, with the best chances of warmth in the Deep South and Southern Rocky Mountains.
Image and forecast is from Dec. 18, 2025
I know some of us can’t stand the snow, but I believe most of us agree that snow during the holidays is nice to see, for at least a little bit. But our frigid weather came too early.
At Atlantic City International Airport, the likelihood of an official white Christmas — at least 1 inch of snow on the ground — is 6%. There’s also a 6% chance of any snow at all falling on Christmas.
Farther south, Lower Township has a 5% chance of a “technical” white Christmas, with the probability of snow falling on Dec. 25 at 3%.
Up the coast is where the best chance of a Jersey Shore white Christmas can be found. Long Branch has a 15% chance of at least 1 inch of snow on the ground, and a 7% chance that Dec. 25 will have at least some snowfall throughout the holiday.
Our last official white Christmas at the Jersey Shore was in 2009. Do you remember that one? I was a freshman at Rutgers University then. I still remember waking up at my parents’ house in Central Jersey and seeing how bright Christmas morning was with the sun reflecting off the snow.
We got darn close last year, though. A cold front brought snow showers on Dec. 24, 2024. However, only a trace, or unmeasurable amount of snow was recorded. Your grass or car may have been dusted with snow, but Christmas Day, it was gone.
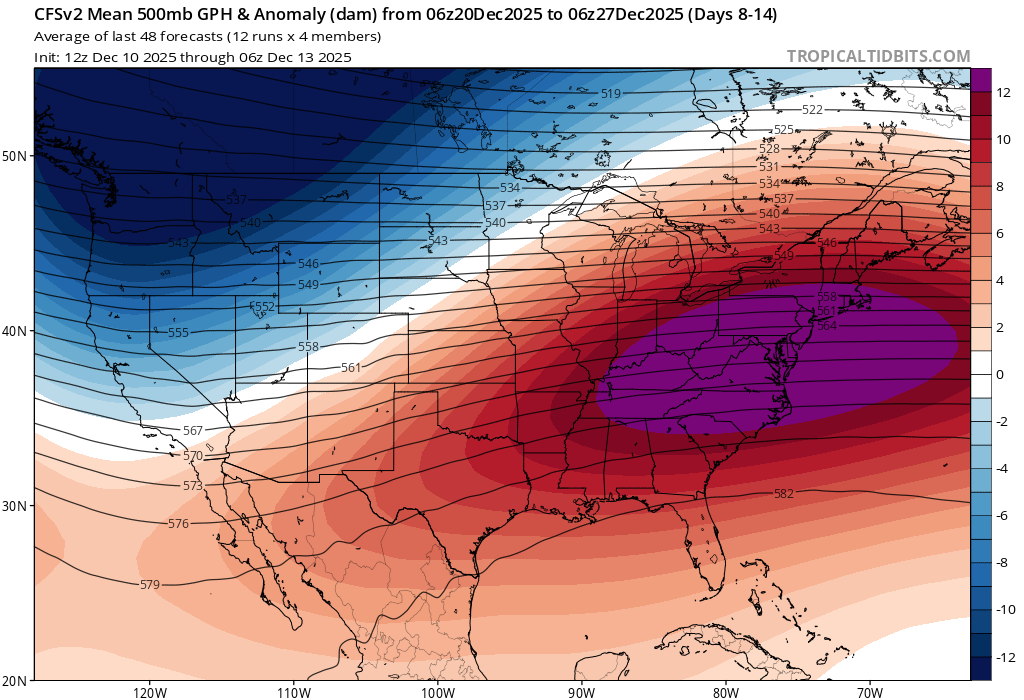
The big feature in our weather forecast next week will be a thicker-than-usual atmosphere over the Northeast. Called a ridge, this thicker atmosphere can hold more heat in. On the surface, high pressure should more or less hang out near Bermuda. That means a milder wind out of the south most days, including Christmas.
The forecast for roughly 18,000 feet high above sea level for the week of Christmas. The purple area over New Jersey means the atmosphere, is much thicker than usual for December. That allows for warmer air to potentially move in.
While winter time Bermuda highs don’t bring hazy, hot and humid weather like they do during the summer, they do keep the Snow Miser out.
Highs around 50 degrees seem like a good bet to make as I write this 7 day before the holiday. I feel pretty confident that the beaches will be above freezing Christmas morning, too. A little precipitation is possible but this would very much likely be rain, not snow.
Traveling across the United States next week looks fairly good, too.
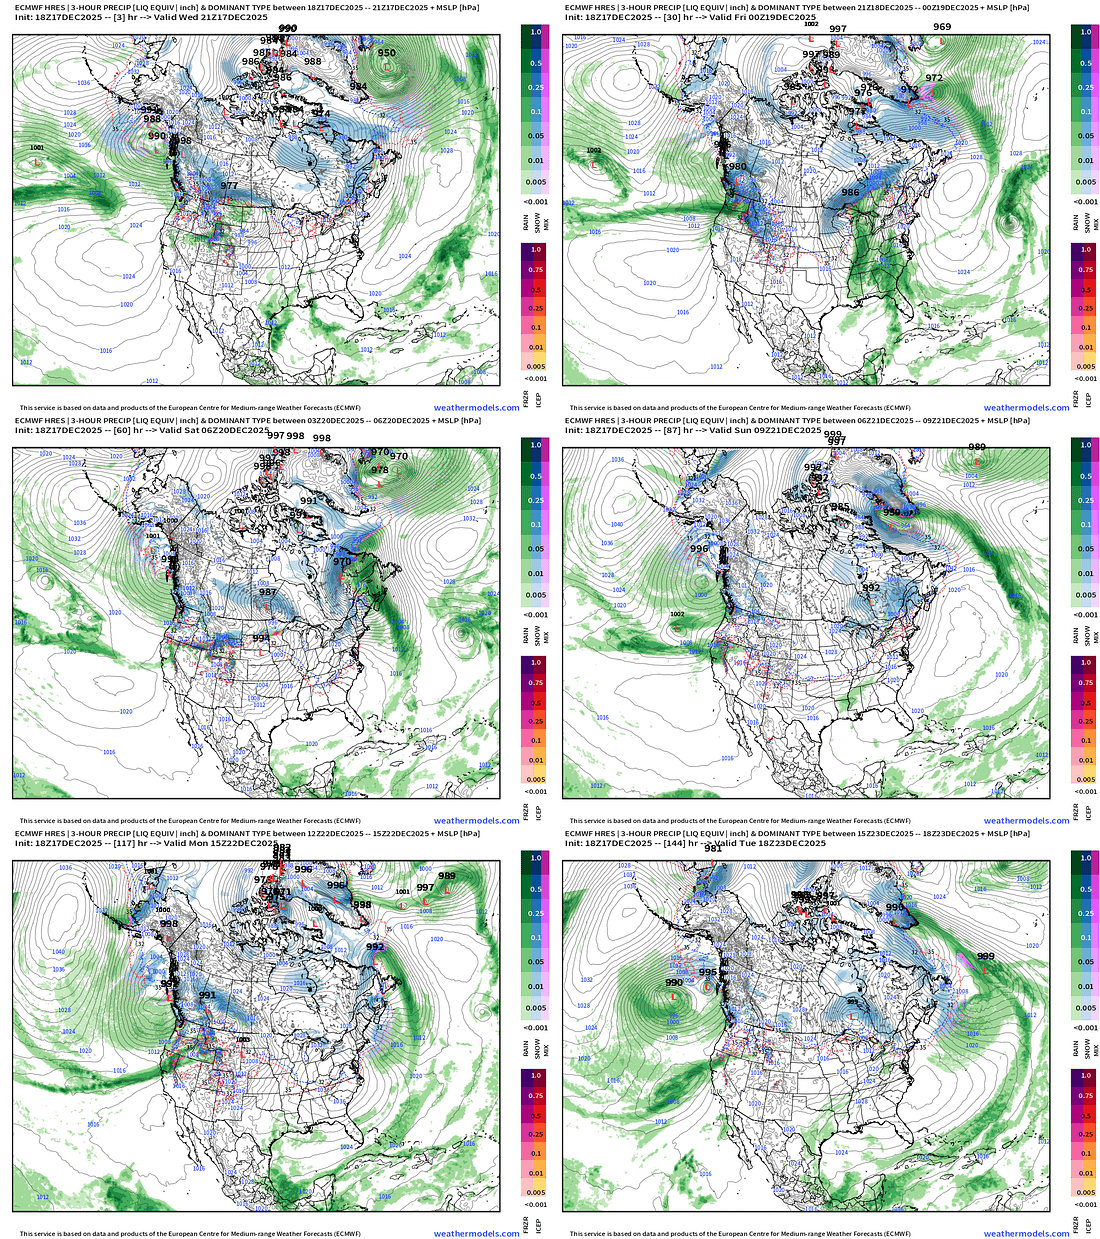
Then, a round of snow, caused by an atmospheric river slamming into the West Coast, will pass through northern California and the Pacific Northwest Dec. 21-22. It then moves through the most northern tier of states as snow. That means Montana, North Dakota, northern Minnesota, Wisconsin and northern Michigan are the areas that would see snow.
Forecast precipitation and sea level pressure from Dec. 18 to Dec. 23, 2025. The storm that hits the Pacific Northwest later this weekend will then travel across the northern tier of states next week.
Those airports can manage this kind of snow, though. If you’re going there next week, that’s awesome. I’d like to check out those areas.
If you like the thaw, I have good news. The polar vortex should be back at its home at the North Pole through the end of the month, at least. So, a long-lasting cold shot like we just had early in the month, won’t happen again until mid-January at the earliest.
Joe Martucci, a certified broadcast meteorologist and digital meteorologist, is also the president and director of meteorology for Cup A Joe Weather and Drone. You can connect with him at www.cupajoe.live.
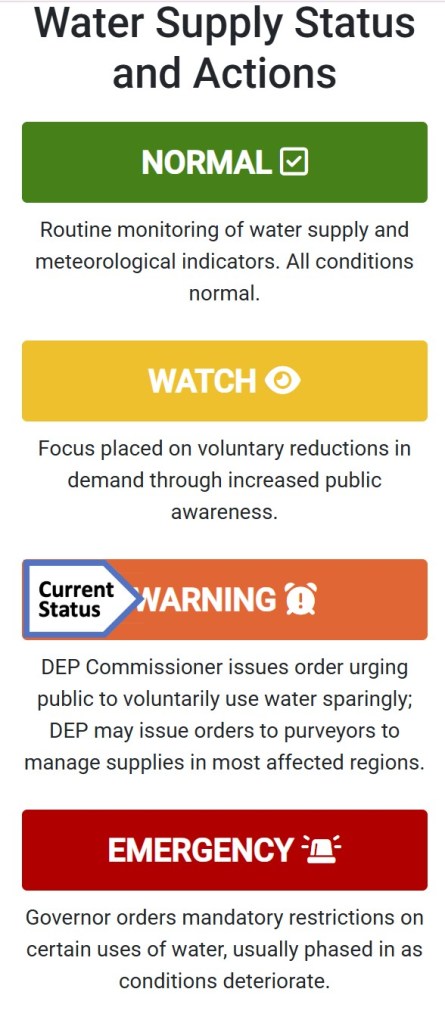
On Dec. 5, the New Jersey Department of Environmental Protection (NJDEP) issued a drought warning for the state. It brings back not-so-distant memories of barely flowing streams and record dry weather. However, unlike the previous drought warning, Jersey Shore fares the best in the state this time around.
A drought warning is not an emergency yet — it’s an early step to manage water supplies when a drought is starting to happen. It comes after a drought watch, but before a full drought emergency. The main goal of a drought warning is to stop things from getting so bad that the state must declare a real water emergency.
Via the NJDEP
“All New Jerseyans are requested to follow water conservation practices, and to use water wisely, particularly when using water outdoors,” the NJDEP wrote in their statement.
To be clear, there are no state mandatory water restrictions in place. That can only be issued if the governor declares a drought emergency. However, like we saw with New Jersey American Water last fall, water companies can issue their own restrictions to users.
The last drought warning was in effect from November 2024 to June 2025. That came just after the driest autumn on record for New Jersey. Even after June, the NJDEP still had Atlantic and Cape May counties on a drought watch, to increase our awareness of the impact on our water supply.
In the previous drought warning, the Jersey Shore had the most severely dry conditions. This time though, the coast is making out better than our friends to the west and north.
The United States Drought Monitor, which is unaffiliated with the NJDEP, issues drought updates every Thursday, using data from the previous Tuesday.
As of Dec. 4, the most recent update at the time of this writing, Cape May County, from Sea Isle City to Dennis on south, is in the first stage of drought, called “moderate drought.” The rest of the Jersey Shore is completely drought-free, though. Data shows that 55% of New Jersey is in drought, though.
Most of that is on the Delaware Bayshore and then roughly the New Jersey Turnpike northwest. About 10% of the state is in the second level of drought, known as severe drought. That’s mainly in Sussex, Salem and Cumberland counties.
The drought monitor looks mainly at the precipitation, soil, rivers and plants. Meanwhile, the NJDEP focuses on reservoirs and drinking water. Both are useful tools, though we in New Jersey will act based on the NJDEP, not the drought monitor.
Either way, both agree that the Jersey Shore is least impacted by drought.
Then came November. It was drier than average. Cape May and Atlantic counties picked up between 1 to 2.25 inches of precipitation. The average for November is 3.37 inches at Atlantic City International Airport, and 3.44 inches at Sen. Frank S. Farley Marina in Atlantic City, according to the National Oceanic and Atmospheric Administration. So, it was dry.
It was even drier than average in the north. November in Boonton (Morris County) and Belvidere (Warren County) were among the driest 20% on record.
At the same time, the shore continues to pick up the most from whatever rainmakers we get. On Dec. 2, over an inch fell in Egg Harbor Township, Cape May Court House and Atlantic City. Much of Northwest New Jersey had less than a half inch.
However, we need to look at more than just what’s happened recently to get a picture of our drought situation. Drought usually is long term, occurring over multiple years. We’re probably in the middle of one. We’ll improve at times, but the ground in New Jersey is dry and has been dry for at least a year. A wetter month here and there is good. A months-long, sustained period of ample rain and snow is needed to buck this trend, though.
Groundwater levels and stream flows over the past 90 days are “extremely dry” in the Coastal South region, according to the NJDEP’s Dec. 7 update. That’s roughly Toms River to Seaside Heights on south. It’s been this way for multiple weeks. We rely on groundwater from the Kirkwood-Cohansey aquifer for our freshwater needs.
The location of the Kirkwood-Cohansey aquafer in blue, within New Jersey (via the state of New Jersey)
There was improvement during the summer, but we haven’t been “near or above normal” in at least a year.
Like last year, having a drought during the cool season is better than having one during the warm season. Sprinklers are turned off, pools and water parks are closed and water usage is just less. Moreover, the sun is weak and doesn’t evaporate as much water as in the summer.
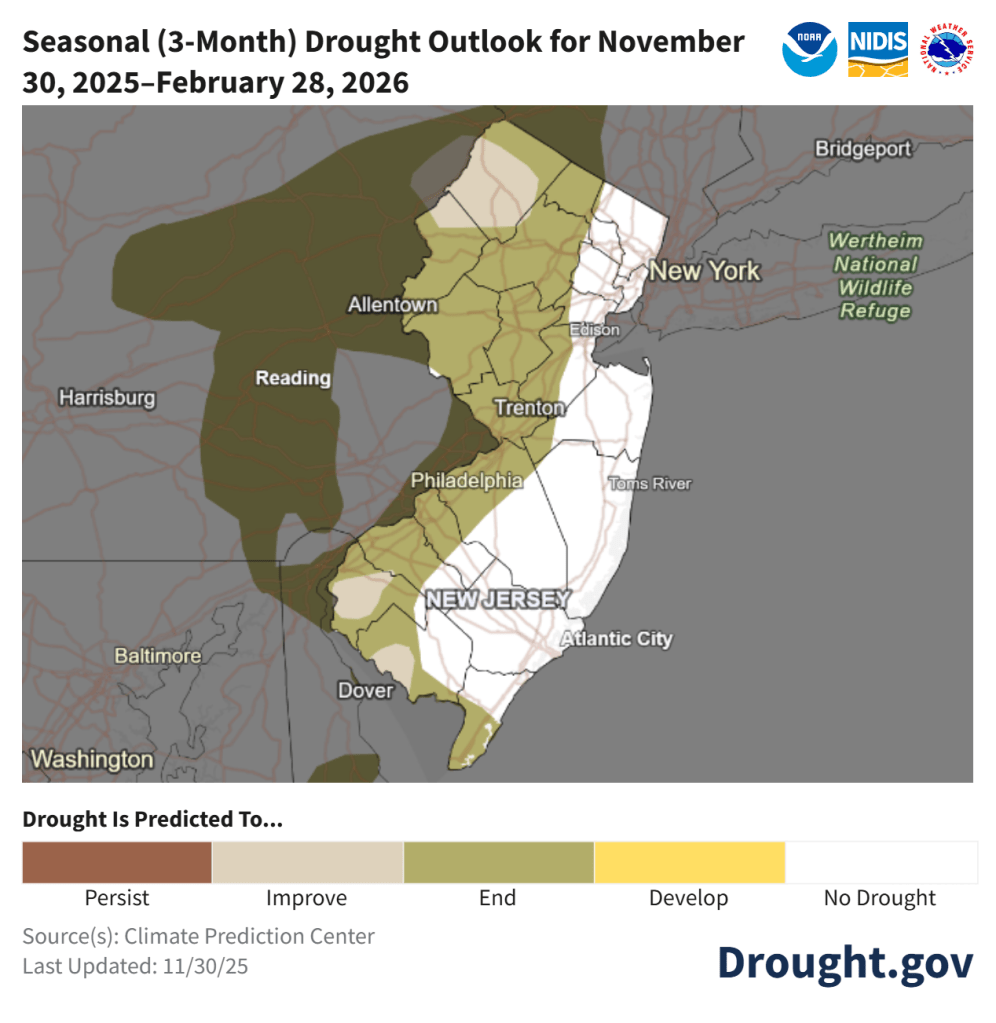
So, does that give us enough runway to pull out of this drought? NOAA believes so. For the areas the US Drought Monitor has in a drought now, an improvement is expected over the winter according to their Nov. 30 update. For December, there is a lean toward a wetter (perhaps whiter) than average month.
For now, reduce water usage where you can. It’s not as big of a problem as last winter. This will be monitored closely.
Joe Martucci, a Certified Broadcast Meteorologist and Digital Meteorologist, is the President and Director of Meteorology for Cup A Joe Weather and Drone. You can connect with him at cupajoe.live/.